How to create a Motion Chart in Tableau
Tableau Installation Tutorial for Beginners, are you looking for the information of tableau server installation steps under tableau course? Or the one who is casually glancing for the best platform which is providing information on how to install tableau software for beginners? Then you’ve landed on the Right Platform which is packed with tons of tutorials of installation of tableau. Follow the below mentioned Tableau Installation tutorial for Beginners which were originally designed by the world-class Trainers of
Tableau Training institute Professionals.
If you are the one who is a hunger to become the certified Pro Tableau Developer? Or the one who is looking for the
best tableau Training institute which offering advanced tutorials and
tableau certification course to all the tech enthusiasts who are eager to learn the technology from starting Level to Advanced Level.
Motion Charts are used to make highly professional animated charts. This help to enhance the readability of data. One of the benefits of motion charts is that it shows how data changes with respect to changes in variables.
Let’s explore Motion Charts in detail. Here, we have used Sample EU Superstore Data which is provided by Tableau by default.
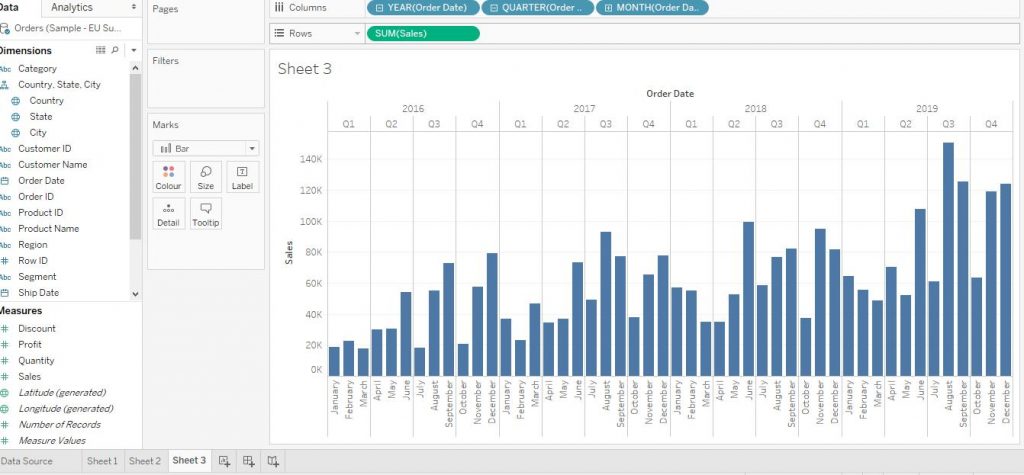
Firstly make a
bar graph which we have already taught earlier.Drag Order Date, month wise from Dimensions section to the Columns shelf and drag Sales from Measures section to Rows shelf. Again, from Show Me section click on bars. Please refer to the chapter for more detailed information. This image of the bar graph below shows the step.
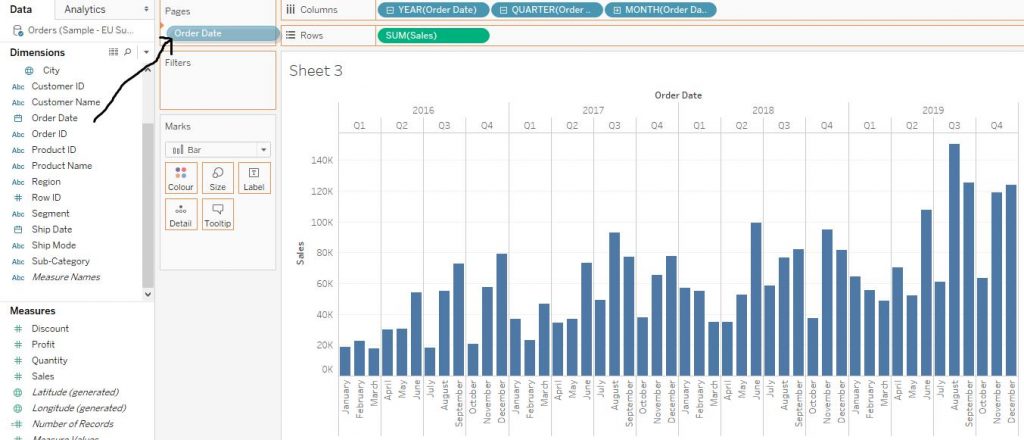
Now drag the variable Order Date from Dimensions section to Pages card. The arrow in the diagram below helps to understand the following step.
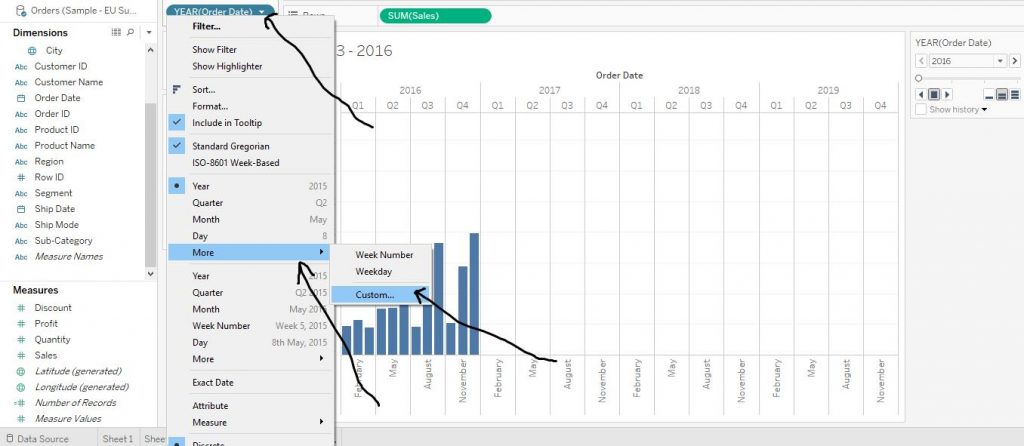
Click on the little arrow beside the Year of Order Date variable on Pages card. Then from the drop down menu, click on More and then click on Custom. The arrows in the diagram given below explain the step.
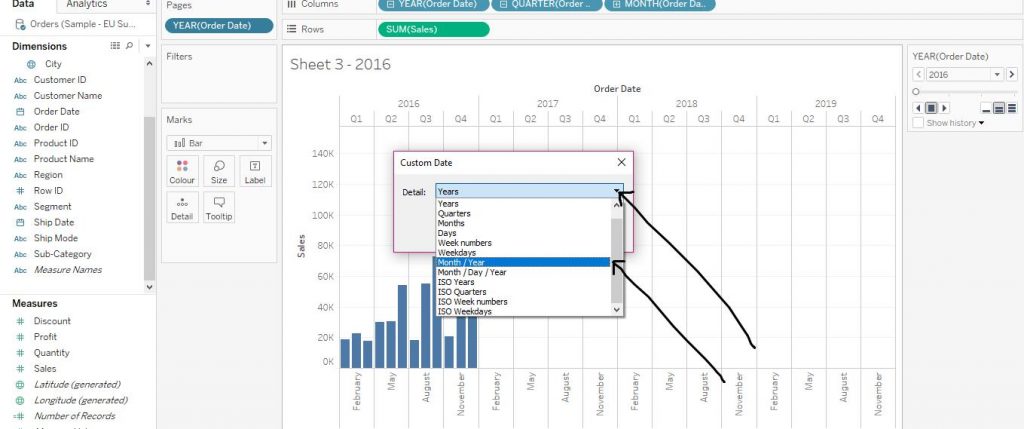
Now from the drop down menu of Detail, click on Month/Year and then click on OK.
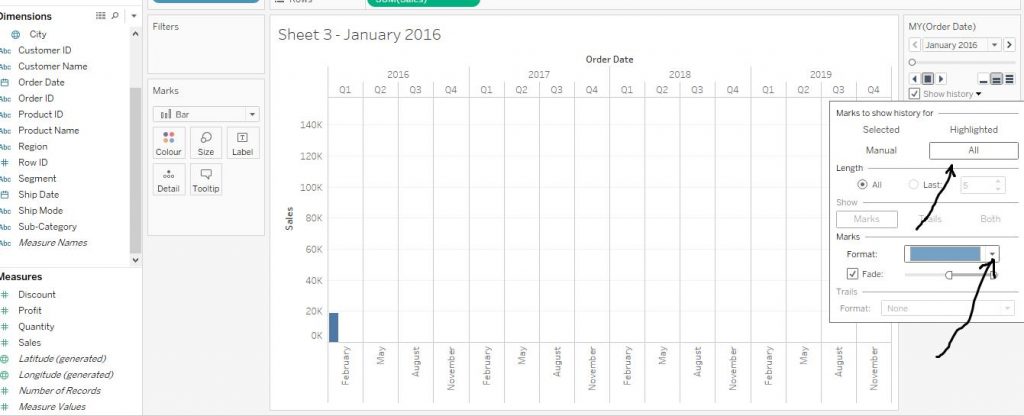
Again, from the MY (Order Date) Option on the right hand side, tick the Show history option. Then click on the little arrow beside it. From the drop down menu, click on All. Choose a format colour as per your choice from the Marks section. The step is described by the arrows in the diagram given below.
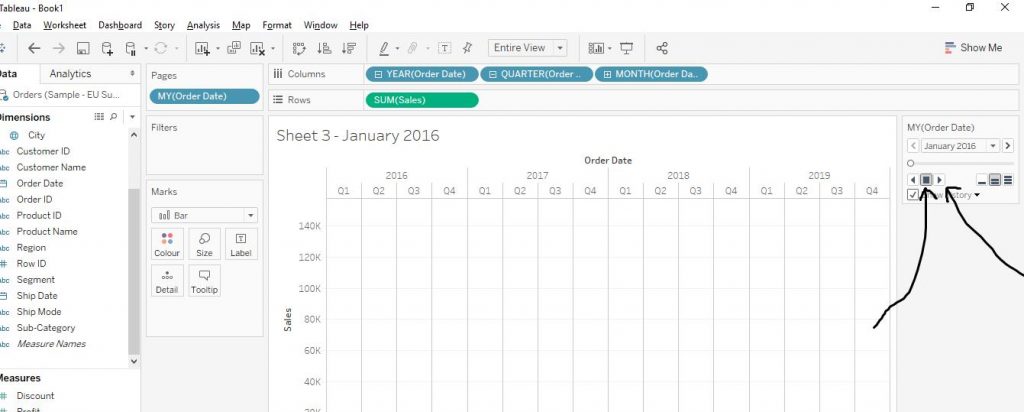
Now in order to see the Motion Chart, click on the play button from My (Order Date) section and then click on the forward button. This will create the motion chart and also would show the bars of previous time period in faded hues.
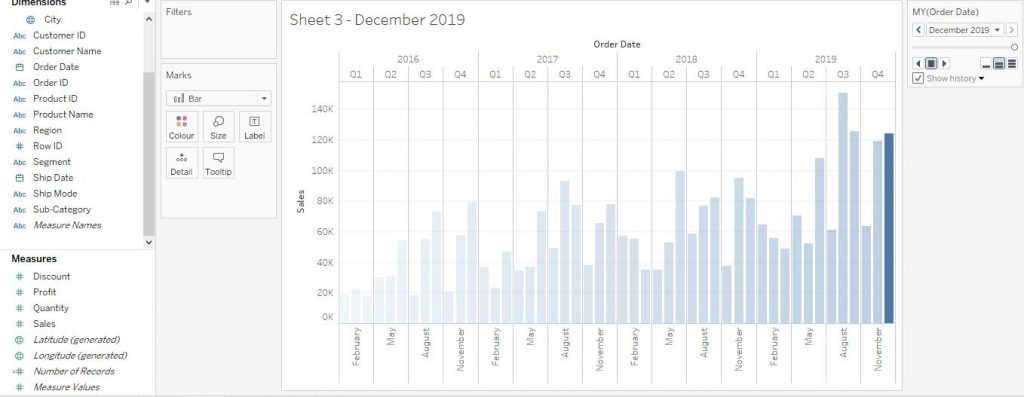
The diagram below shows the final output of the animated graph.
We hope you understand Tableau Installation tutorial for beginners.Get success in your career as a Tableau developer by being a part of the
Prwatech, India’s leading
Tableau training institute in Bangalore

