Introduction to T-test Statistics, hunting for the best platform which provides information about t-test statistics? Then welcome to the land of introduction to t-test statistics in Data Science. In this tutorial, one can explore t-test statistics with examples and differences between t score and z score which were prepared by India’s leading Data Science training institute professionals.
Thinking of having a career as a Data analyst? Planning to go for a certification in Data science and related subjects but still not getting a conviction whether it is the right thing to do or not? Confused about whether to invest time in gaining knowledge of Data science or not? Such questions can give you sleepless nights, but by taking an advanced data science course from India’s largest E-Learning data science training institute in Bangalore, I am sure you will get a lot of reasons to build a data science career.
What is the T-test Statistics?
The T-test Statistic is required in a T-test when you are in a position to decide if you should accept or reject the null hypothesis.
It’s somewhat similar to a Z-score and you use it in the same way, i.e. to find a cutoff point or to find your t score or to compare the two.
You use the T-statistic when you have a small sample size, or if you don’t have the population standard deviation.
The T statistic does not really tell you much on its own. It’s just like the word “sum” doesn’t mean anything on its own, without some context. If I say “the sum was 550000,” it means nothing.
But if I say “the sum of salaries of employees is Rs.550000” in an organization then the picture becomes clearer. In the same way, you need some more information along with your t-statistic for it to make some sense. You get this information by taking a sample or by running a hypothesis test.
Why we need T-test Statistics?
When you implement a hypothesis test, you use the T statistic with a p-value.
The p-value indicates what the odds are that your results could have happened by chance. Let’s consider you with some of your friends score an average of 215 on a bowling game. You know the average bowler scores 79.9.
So in order to decide that you and your friends should consider professional bowling? Or are those scores a fluke? Finding the t-statistic and the probability value will give you a good idea. To be more technical, finding those values gives you evidence of a significant difference between your team’s mean and the population mean (i.e. everyone).
The greater the value of T, the more evidence you have that your team’s scores are significantly different from average.
Smaller the value of T value is evidence that your team’s score is not significantly different from average. It’s pretty obvious that your team’s score (215) is significantly different from 79.7, so you’d want to take a look at the probability value.
If the p-value is larger than 0.05, the odds are your team getting those scores are due to chance. Very small (under 0.05), you’re onto something: think about becoming a professional.
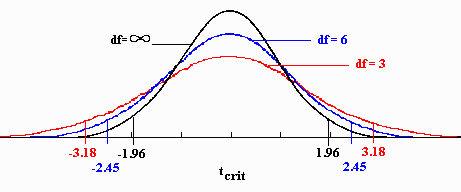
T score vs z score statistics
The Z-score allows you to decide whether your sample is different from the population mean. In order to use z-score, you must know four things:
The population mean.
The population standard deviation.
The sample mean.
The sample size.
Mostly in statistics, you don’t have any knowledge about a population, so instead of a Z score, we use a T-Test with a T Statistic. The major difference between using a Z score and a T statistic is that you need to estimate the population standard deviation.
The T-test is also used when you have a small sample size (less than 30).
T-test Statistics Formula
The T-statistic can be found in so many different ways, there is no single formula for it. It depends on what type of test you are trying to do.
T-test Statistics Example
One sample t-test. This is one of the most common types of t-test which you’ll come across in elementary statistics. You can test the mean of a single group against a known mean. For example, take the average IQ as 100. You can examine a class of students with a mean score of 90 to see if that’s significant, or if it occurs by chance.
A paired t-test compare means from the same group at different times (say, one year apart). For example, you can try a new weight loss technique on a group of people and follow up a year later.
We hope you have understood the basics of the T-test statistics tutorial and its formula with examples in data science. Interested in learning more? Then get enroll with Prwatech for advanced Data science training institute in Bangalore with 100% placement assistance.