Python Matplotlib
Python Matplotlib for Beginners
Prerequisites
Hardware : Local Machine
Software : Jupyter Notebook
Programming Language : Python
Definition:
Matplotlib is a cross-platform, data visualization and graphical plotting for Python.
Jupyter Notebook Introduction:
Jupyter is a free, open-source, interactive web tool which known as a computational notebook, which anybody can use to combine software code to get the computational output, explanatory text in a single document.
PLOT A LINE IN Matplotlib:
You can run the following code in Jupyter Notebook:
Click this link to open Jupyter Notebook – https://jupyter.org/
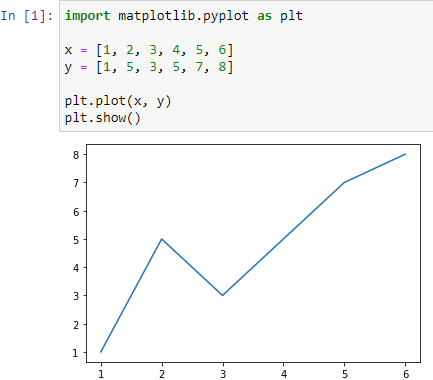
plt.plot() –
A function which is used to plot the points between x and y.
plt.show()
Function which shows the plot.
What is Matplotlib?
Each pyplot function can make any changes to a figure. For example It can create a figure, It can also create a plotting area in the figure, A function which plots some lines in a plotting area
What is Pyplot?
Pyplot package can be considered as plt.
SIMPLE PLOT:
Let’s display a simple line plot by using the math module which uses mathematical functions.
Here is the program for the reference Simple Plot:
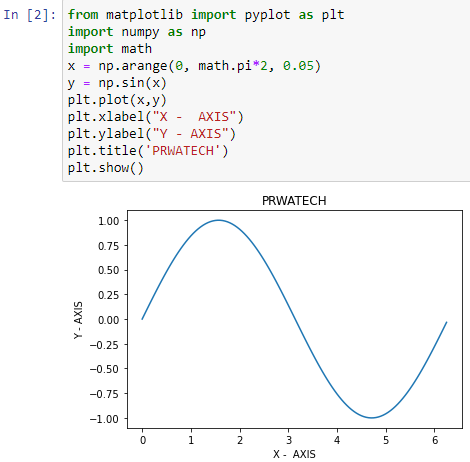
What is Numpy?
NumPy is a module for the Python programming language for large multi-dimensional arrays and matrices
import numpy as np – In simple terms making short “numpy” to “np” to make your code easier to read.
import math – . The math module uses mathematical functions
np.arrange() –
NumPy arange() Creation of an array using routines based on numerical ranges. It is also for Setting the coordinates
np.sin() –
It is a mathematical function which helps user to calculate trignometric sine.
plt.plot() –
A function which is used to plot the points between x and y.
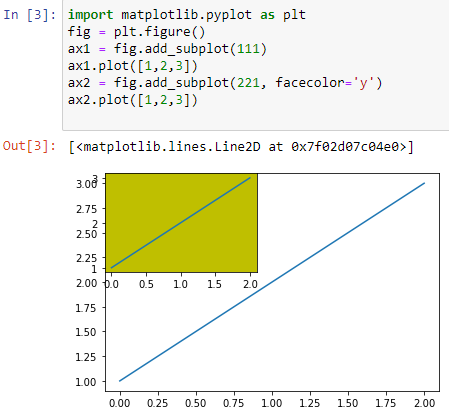
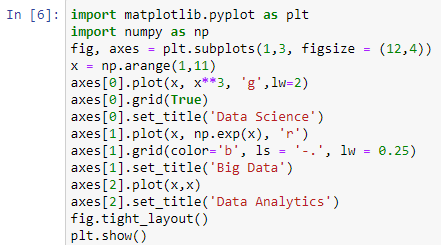
MULTI PLOT:
This allows to draw multiple graphs in a single plot.
A subplot () function is known as wrapper function which allows user to plot more than one graph in a single figure
Here is the program for the reference Multi Plot:
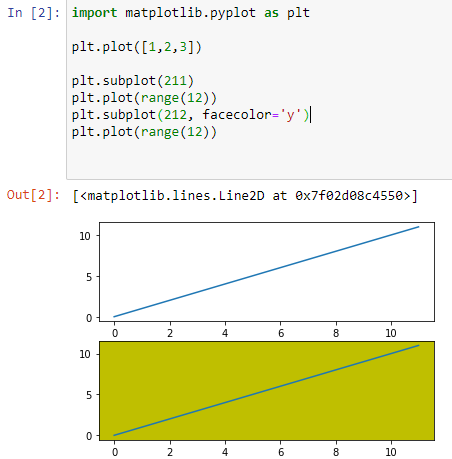
plt.plot([1, 2, 3)]
Plot a line, Implicitly creating a subplot
What is a Subplot?
Subplots can connect to main plots.
plt.subplot(211)
Creation of a subplot that represents the top plot of a grid with 2 rows and 1 column.
plt.subplot(212, facecolor=’y’)
As we can see it creates 2nd subplot with yellow background
BAR PLOT:
A bar graph is the visualization which shows the comparison among discrete categories. X axis of the chart shows the categories which are compared, and Y axis represents a measured value.
Here is the program for reference for Bar Plot:
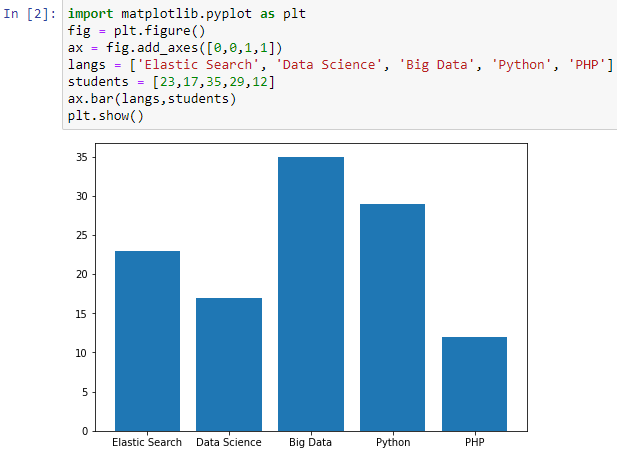
fig = plt.figure()
figure() A function which is used to create a figure object.
ax = fig.add_axes
It is a figure module of matplotlib which is used to add axes to the figure.
ax.bar()
A module of matplotlib is used to make a bar plot.
plt.show()
Function to show the plot.
HISTOGRAM:
A histogram represents the numerical data. It is also known as the other form of Bar Graph.
Here is the program for the reference Histogram:
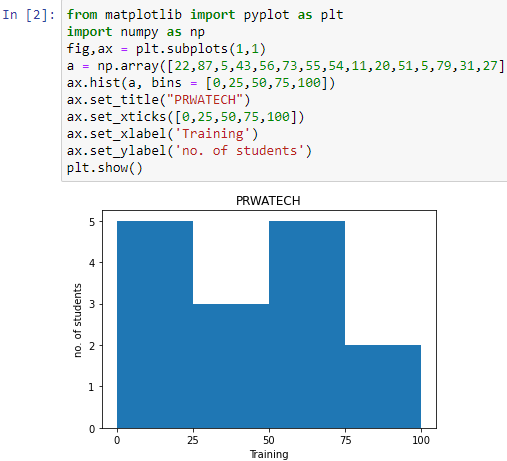
np.array()
A function which includes Array elements
ax.hist()
It is an essential function that is to plot a histogram graph.
ax.set()
A function which is know to be a property, In other words it is a batch setter, Be it Title set or a Label Set
plt.show()
A function to show the plot.
PIE CHART:
A Pie Chart displays one series of data. Pie charts shows the size of subjects in one data series in different divisions, The data points are shown in percentage in a Pie chart.
Here is the program for the reference Pie Chart:
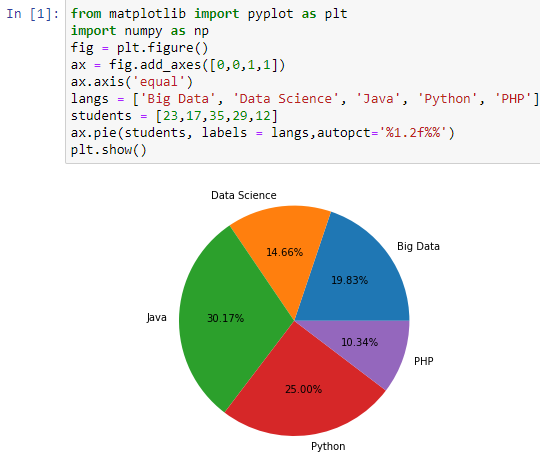
import numpy as np
In simple terms making short “numpy” to “np” to make your code easier to read.
fig = plt.figure()
figure() A function which is to create a figure object.
ax.pie
A function of Matplotlib library which is to plot a pie chart Graph.
plt.show()
A function to show the plot.
Matplotlib – Scatter Plot
Scatter plots are knows to be of plotting data points on horizontal and vertical axis in the attempt to show how much one variable is affected by another.
A scatter plot is a diagram which is displayed in a graphical format where each value in the data set is represented by a single dot.
Here is a program for the reference Scatter Plot:
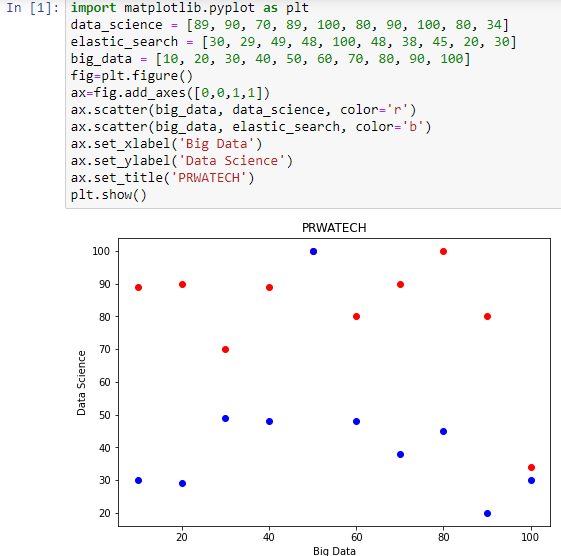
fig = plt.figure()
figure() A function which is to create a figure object.
ax = fig.add_axes()
To add the coordinates
ax.scatter
It is a module of Matplotlib library which is to plot a scatter plot graph.
ax.set_title()
To set the Title on the Top of the Graph
CONTOUR PLOT
Contour plots displays a 3 dimensional surface on 2 – dimensional plane.
Here is the program for the reference Contour Plot:
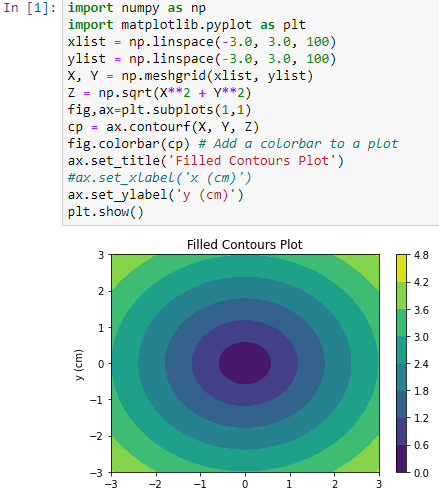
np.linespace
The np. linspace is a tool in Python for creating numeric sequences. It is kind of similar to np.arrange() function.
np.meshgrid
The numpy.meshgrid function is used to create a rectangular grid out of two given 1 – dimensional arrays.
np.sqrt
A Function which is to determine the positive square-root of an array, in a specific way, element-wise.
ax.contour
It is a function of matplotlib is to Plot contours. contourdraw contour lines.
fig.colorbar(cp)
It is a function of matplotlib is to add a color bar to a plot.
ax.set_title()
To set the Title on the Top of the Graph
plt.show()
A function to show the plot.
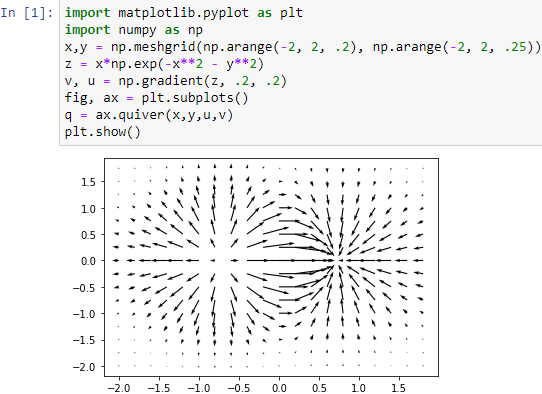
QUIVER PLOT
A quiver plot displays the velocity vectors as arrows with components.
Here is the program for the reference Quiver Plot:
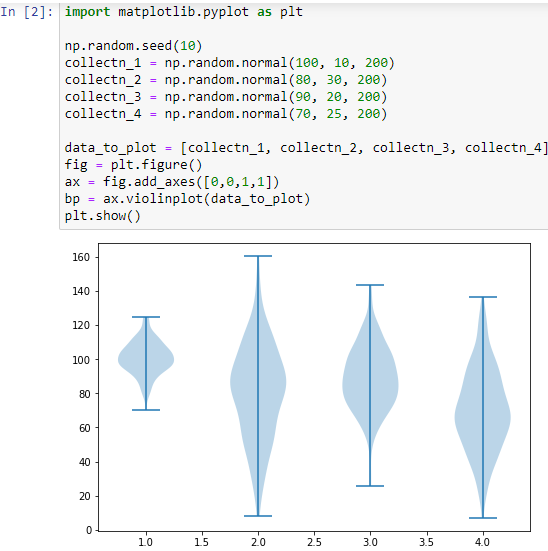
VIOLIN PLOT
Violin plots are identical to box plots, exception is that they also show the probability density of the data at different pace of values.
A violin plot is much more informative than a plain box plot.
Here is the program for the reference Violin Plot:
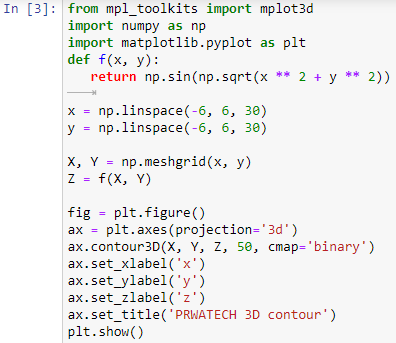
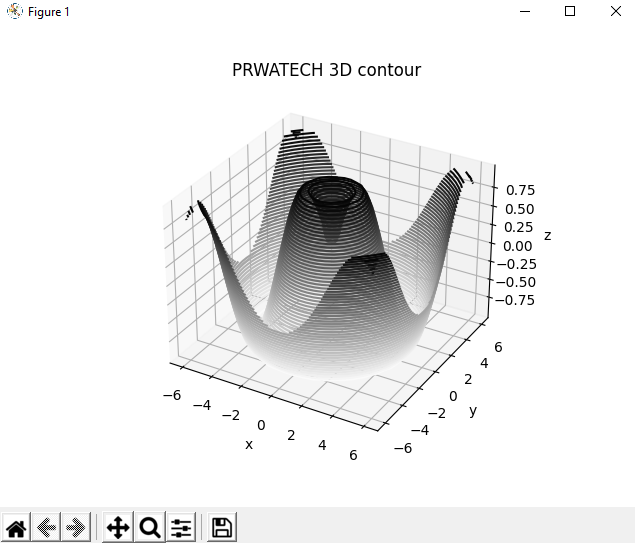
3 D CONTOUR PLOT
ax.contour3D()
It is a function creates three-dimensional contour plot.
Here is the program for the reference 3D Contour Plot:
Output:
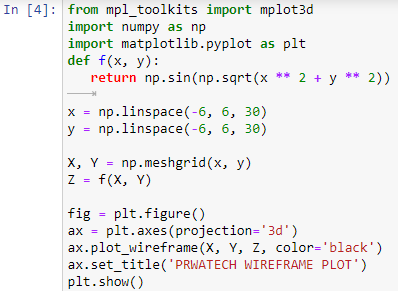
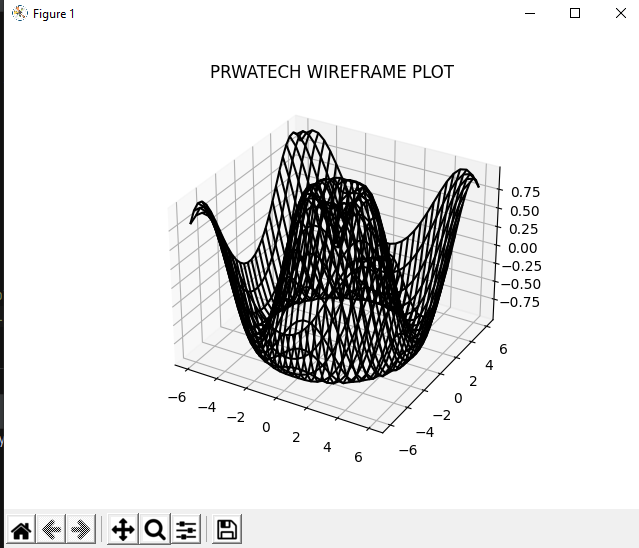
3D WIREFRAME PLOT
Wireframe plot takes a grid of values and projects it onto the specified three-dimensional surface
Here is the program for the reference 3D Wireframe plot:
Output:
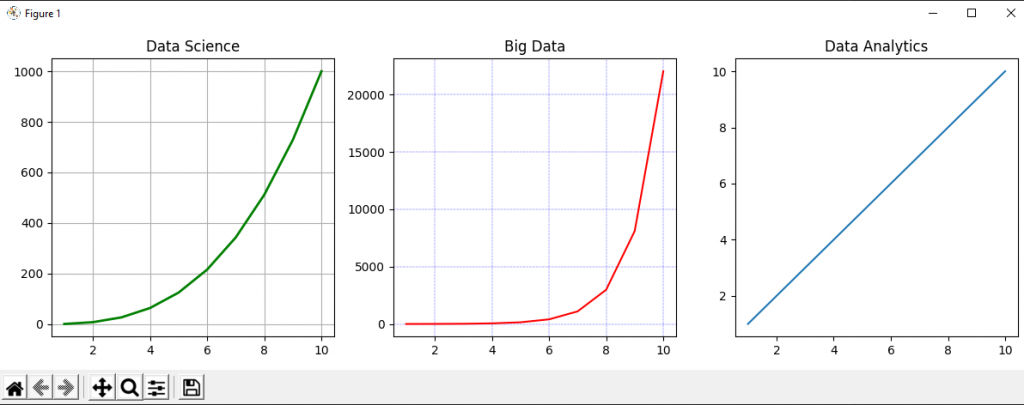
GRIDS
The grid() function of axes object sets visibility of grid inside the figure to on or off.
Here is the program for the reference Grids:
Output: