Naive Bayes Classifier in Machine Learning
Naive Bayes Classifier in Machine Learning, in this Tutorial one can learn naive bayes classifier tutorial. Are you the one who is looking for the best platform which provides information about know How Naive Bayes Algorithm Works,introduction to naive bayes algorithm, naive bayes classifier example? Or the one who is looking forward to taking the advanced Data Science Certification Course with Machine Learning from India’s Leading Data Science Training institute? Then you’ve landed on the Right Path. Bayes theorem finds many uses within the applied mathematics and statistics. There’s a micro chance that you just just haven't heard about this theorem in your life. seems that this theorem has found its way into the planet of machine learning, to make one in all the highly decorated algorithms. Naive Bayes may be a probabilistic machine learning algorithm supported the Bayes Theorem, utilized in a good style of classification tasks. The Below mentioned naive bayes classifier Tutorial will help to Understand the detailed information about Naive Bayes Classifier in Machine Learning, so Just follow all the tutorials of India’s Leading Best Data Science Training institute in Bangalore and Be a Pro Data Scientist or Machine Learning Engineer.Introduction to Naive Bayes Algorithm
Naive Bayes is a classification technique which is based on Bayes’ Theorem. It holds the assumption of independence among predictors. Bayes’ Theorem is a way of calculating a probability when we know certain other probabilities. The formula is:P(A|B) = (P(A)* P(B|A)) / P(B)
P(A|B): indicates how often A happens, given that B occurs. P(B|A): indicates how often B happens, given that A occurs. P(A): Indicates how A is on its own. P(B): Indicates how B is on its own. Let us say P(Rain) means how often there is Rain, and P(Cloudy) means how often we see Cloudy weather, then: P(Rain|cloudy) means how often there is rain when we can see cloudy weather. P(Cloudy|Rain) means how often we can see cloudy weather when there is rain. So, the formula kind of tells us "forwards" P(Rain|Cloudy) when we know "backwards" P(Cloudy|Rain).Naive Bayes Classifier Example
To start with, let us consider a data set.| Outlook | Temperature | humidity | windy | Cricket | |
| 0 | Rainy | Hot | High | False | No |
| 1 | Rainy | Hot | High | True | No |
| 2 | Overcast | Hot | High | False | Yes |
| 3 | Sunny | Mild | High | False | Yes |
| 4 | Sunny | Cool | Normal | False | Yes |
| 5 | Sunny | Cool | Normal | True | No |
| 6 | Overcast | Cool | Normal | True | Yes |
| 7 | Rainy | Mild | High | False | No |
| 8 | Rainy | Cool | Normal | False | Yes |
| 9 | Sunny | Mild | Normal | False | Yes |
| 10 | Rainy | Mild | Normal | True | Yes |
| 11 | Overcast | Mild | High | True | Yes |
| 12 | Overcast | Hot | Normal | False | Yes |
| 13 | Sunny | Mild | High | True | No |
This concept can be understood with relation to our data set as follows:
We assume that there is no any pair with dependent features. Example, the temperature categorized as ‘Hot’ has no dependency on humidity or the view being ‘Rainy’ has no effect on the winds. So, the features are expected to be self-governing. And each feature is given the same weight. In this example, knowing only temperature and humidity we can’t forecast the outcome precisely. None of the attributes is immaterial and assumed to be contributing equally to the outcome. There is needed to make some assumptions in case of continuous data, regarding the distribution of values of each feature. Based on the assumptions made regarding the distribution of P (xi | y), Naive Bayes Classifiers differ from each other.How Naive Bayes Algorithm Works?
Now, we discuss one of such classifiers here. In case of above example, let’s indicate dependent vector by ‘y’ and the set of the features as X where it contains features as: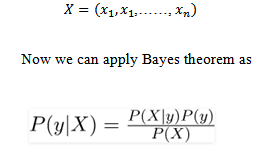 Now we can apply Bayes theorem as
Suppose we consider a case.
X= sunny, mild, Normal, False
So now we have to predict Y
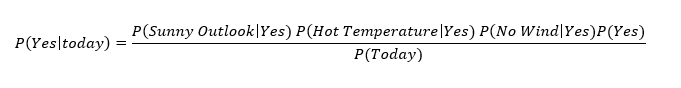
In case of probability that cricket will be played
Now we can apply Bayes theorem as
Suppose we consider a case.
X= sunny, mild, Normal, False
So now we have to predict Y
In case of probability that cricket will be played
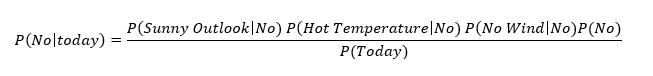
 And in case of probability of not playing cricket we can write equation as:
 After mathematical calculation (with reference of probability concept we can calculate probability of each feature with respect to dependent variable conditions (for y) ‘Yes’ and ‘No’.
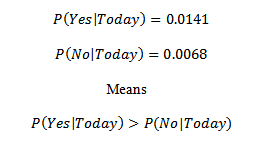 So, finally for combination of: X= sunny, mild, Normal, False
We will get the predicted value of Y As Y= Yes
In this example the data given was of discrete type. What if the data is having continuous nature? For that purpose, we have to apply Gaussian Naive Bayes. The different naive Bayes classifiers have different assumptions regarding the distribution of only by the assumptions they make regarding the distribution of P (xi | y).
So, finally for combination of: X= sunny, mild, Normal, False
We will get the predicted value of Y As Y= Yes
In this example the data given was of discrete type. What if the data is having continuous nature? For that purpose, we have to apply Gaussian Naive Bayes. The different naive Bayes classifiers have different assumptions regarding the distribution of only by the assumptions they make regarding the distribution of P (xi | y).
Gaussian Naive Bayes Classifier
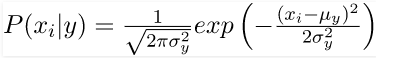
Continuous values related to each feature are assumed to be distributed according to a Gaussian distribution in Gaussian Naive Bayes. A Gaussian distribution is known as Normal distribution. It gives a bell-shaped curve, after plotting, which is symmetric about the mean of the feature values. It can be shown as follows: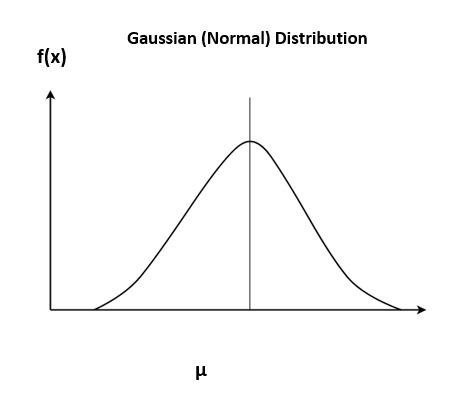 The probability of the features is considered to be Gaussian. The corresponding conditional probability is given by:
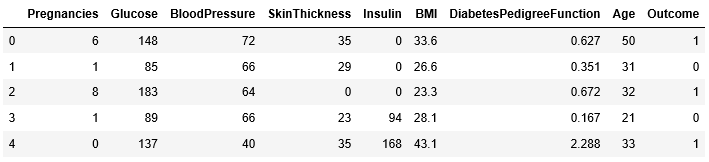
 Now, we will try to implement Gaussian Naive Bayes classifier with scikit-learn.
# Initializing and importing libraries. Loading file
Import pandas as pd Df= pd.read_csv(“Your file Path”)