Poisson Process Tutorial, In this tutorial one, can learn about the importance of Poisson distribution & when to use Poisson distribution in data science. We Prwatech the Pioneers of Data Science Training Sharing information about the Poisson process to those tech enthusiasts who wanted to explore the Data Science and who wanted to Become the Data analyst expert. Are you the one who is looking for the best platform which provides information about what are the advantages and characteristics of Poisson distribution in Data Science? Or the one who is looking forward to taking the advanced Course from India’s Leading Data Science training institute? Then you’ve landed on the Right Path.
Get a clear understand of the definition and characteristics of the Poisson process with India’s Leading Data Science training institute in Bangalore. The Below mentioned tutorial will help to Understand the detailed information about the Poisson process tutorial, so just follow all the tutorials of India’s Leading Best Data Science training institute and be a Pro Data analyst.
Definition of a Poisson process
A Poisson Process is a model for a series of discrete events where the average time between events is known, but the exact timing of events is random.
The arrival of an event is independent of the event before (waiting time between events is memoryless).
Poisson Process Example 1
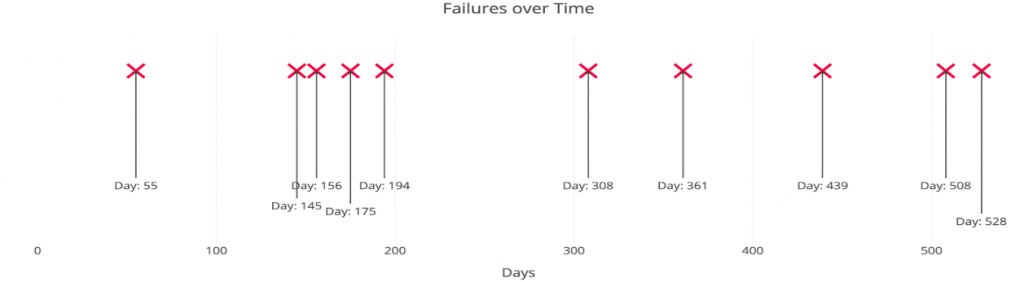
Suppose we an electricity connection, and the provider tells us that electric power goes down on an average of once per 60 days, but one failure doesn’t affect the
probability of the next. All we know is the average time between failures.
This is a Poisson process that looks like:
The important point is we know the average time between events but they are randomly spaced. We might have back-to-back failures, but we could also go years between failures due to the randomness of the process.
Characteristics of Poisson distribution
A Poisson Process meets the following criteria:
Events are independent of each other.
The occurrence of one event does not affect the probability another event will occur.
The average rate (events per time period) is constant.
Two events cannot occur at the same time.
The last point — events are not simultaneous
From our Electric Power example, the entire interval maybe 6000 days, but each sub-interval (we can call it as one day) Electric Power either goes down or it doesn’t.
When to use Poisson distribution
A Poisson experiment is a statistical experiment that has the following properties:
The experiment results in outcomes that can be classified as successes or failures.
The average number of successes (μ) that occurs in a specified region is known.
The probability that success will occur is proportional to the size of the region.
The probability that success will occur in an extremely small region is virtually zero.
Importance of Poisson distribution
A Poisson random variable is the number of successes that result from a Poisson experiment. The probability distribution of a Poisson random variable is called a Poisson distribution.
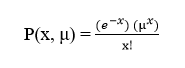
Given the mean number of successes (μ) that occur in a specified region, we can compute the Poisson probability based on the following formula:
Suppose we conduct a Poisson experiment, in which the average number of successes within a given region is μ. Then, the Poisson probability is:
Poisson Process Formula
where x is the actual number of successes that result from the experiment, and e is approximately equal to 2.71828.
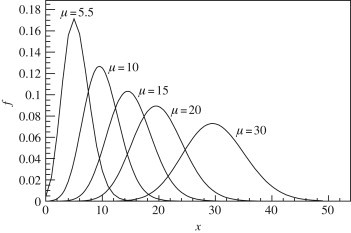
The Poisson distribution has the following properties:
The mean of the distribution is equal to μ.
The variance is also equal to μ.
Poisson Process Example 2
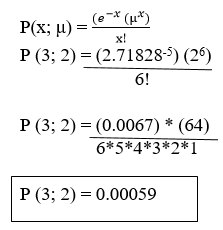
The average number of Projectors sold by some particular company is 5 Projectors per day. What is the probability that exactly 6 Projectors will be sold tomorrow?
Solution: This is a Poisson experiment in which we know the following:
μ = 5; since 5 Projectors are sold per day, on average.
x = 6; since we want to find the likelihood that 6 Projectors will be sold tomorrow.
e = 2.71828; since e is a constant equal to approximately 2.71828.
We plug these values into the Poisson formula as follows:
Thus, the probability of selling 6 Projectors tomorrow is 0.00059.
Interested in learning more? then Prwatech is the best choice to kick start your career in Data Science and to become an expert as Data analyst.
We hope you liked our article on the Poisson Process Tutorial. Share your feedback with your comments.
 The important point is we know the average time between events but they are randomly spaced. We might have back-to-back failures, but we could also go years between failures due to the randomness of the process.
 where x is the actual number of successes that result from the experiment, and e is approximately equal to 2.71828.
The Poisson distribution has the following properties:
The mean of the distribution is equal to μ.
The variance is also equal to μ.
where x is the actual number of successes that result from the experiment, and e is approximately equal to 2.71828.
The Poisson distribution has the following properties:
The mean of the distribution is equal to μ.
The variance is also equal to μ.
 Thus, the probability of selling 6 Projectors tomorrow is 0.00059.
Interested in learning more? then Prwatech is the best choice to kick start your career in Data Science and to become an expert as Data analyst.
We hope you liked our article on the Poisson Process Tutorial. Share your feedback with your comments.
Thus, the probability of selling 6 Projectors tomorrow is 0.00059.
Interested in learning more? then Prwatech is the best choice to kick start your career in Data Science and to become an expert as Data analyst.
We hope you liked our article on the Poisson Process Tutorial. Share your feedback with your comments.

