Empirical rule tutorial, hunting for the best Platform which provides information about empirical rule in Data Science? Then welcome to the land of Empirical rule tutorial on Data Science. In this tutorial one can explore about empirical rule in data science and how to use empirical rule in statistics which were prepared by India’s Leading Data Science training institute professionals.
If you are the one who wanted to become an expert in Data Science? Or the one who wanted to explore the technology like a Pro under the certified experts with World-class classroom Training Environment, then Asks your Data Science Training institute Experts who offer Advanced advanced Data Science training. Follow the below mentioned empirical rule tutorial and enhance your skills to become a professional Data Scientist.
What is Empirical rule in statistics?
The empirical rule states that for a normal distribution of a continuous random variable, nearly all of the data will fall within three standard deviations of the mean.
The empirical rule can be broken down into three parts:
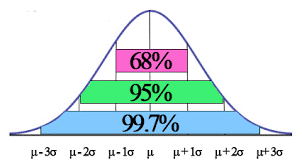
68% of data falls within the first standard deviation from the mean.
95% fall within two standard deviations.
99.7% fall within three standard deviations.
Why we use Empirical rule in statistics?
The Empirical rule is often in statistics for Forecasting, especially when obtaining the actual data is difficult or Impossible. The rule can give you a rough estimate of what your data collection might look like if you were able to survey the entire population.
This rule applies generally to a continuous random variable X, following the shape of a normal distribution, or bell-curve, with a mean and a standard deviation.
The rule doesn’t apply to distributions that are not normal
How to use Empirical rule?
When applying the Empirical Rule to a data set the following conditions are true:
Approximately 68% of the data falls within one standard deviation of the mean (or between the mean – one time the standard deviation, and the mean + 1 times the standard deviation). In mathematical notation, this is represent as μ ± 1σ
pr(μ−σ≤x≤μ+σ) = 68.27
Approximately 95% of the data falls within two standard deviations of the mean (or between the mean – 2 times the standard deviation, and the mean + 2 times the standard deviation). The mathematical notation for this is: μ ± 2σ
pr(μ−2σ≤x≤μ+2σ) = 68.27 %
Approximately 7% of the data falls within three standard deviations of the mean (or between the mean – three times the standard deviation and the mean + three times the standard deviation). The following notation is to represent this fact: μ ± 3σ
pr(μ−3σ≤x≤μ+3σ) = 99.73 %
Empirical Rule Example
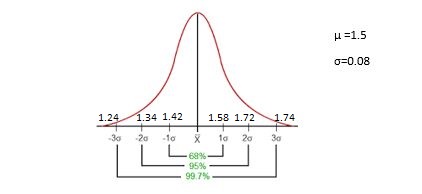
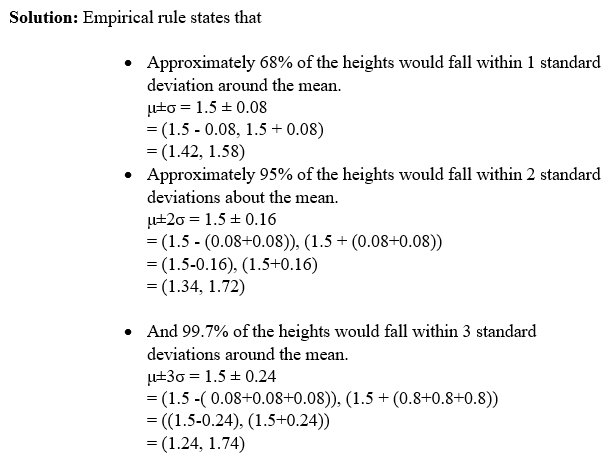
In a recent report, during research in a school, it was found that the heights of the students of class 6 were found to be in a normal distribution. If the mean height is 1.5 and the standard deviation by 0.08; then classify the data in accordance with an empirical rule.
We hope you have understood the basics of the Empirical rule tutorial and its formula with examples in statistics. Interested in learning more? Then Get enroll with Prwatech for advanced Data science training in Bangalore with 100% placement assistance.