Hypothesis testing tutorial, hunting for the best platform which provides information about Hypothesis testing p-value method? Then welcome to the land of Hypothesis testing tutorial in Data Science. In this tutorial, one can explore about Hypothesis testing with examples and how to calculate Hypothesis testing using the p-value method which were prepared by India’s Leading Data Science training institute professionals.
If you are the one who wanted to become an expert in Data Science? Or the one who wanted to explore the technology like a Pro under the certified experts with world-class classroom training environment, then start taking Data Science training from Prwatech who can help you to guide and offer excellent training with highly skilled expert trainers. Follow the below-mentioned Hypothesis testing tutorial using p-value and enhance your skills to become a professional Data Scientist.
Hypothesis testing definition
A statistical hypothesis is an assumption made about a population parameter. This assumption may or may not be right.
Hypothesis testing is a formal procedure used by statisticians to approve or disapprove a statistical hypothesis.
Types of Hypothesis testing
Statistical Hypothesis
The best way to determine whether a statistical hypothesis is right would be to examine the entire population.
Since that is often not possible, we typically take a random sample from the population and examine the same. If the sample data set is not consistent with the statistical hypothesis, the hypothesis is rejected.
There are two types of statistical hypotheses.
Null hypothesis (Ho): It is usually the hypothesis that the event will not occur.
The alternative hypothesis (H1 or Ha): It is a hypothesis that the event will occur.
Both the Null Hypothesis and Alternative Hypothesis must be mutually exclusive events.
Why we need Hypothesis Testing?
Suppose a certain cosmetic producing organization wants to launch a new Shampoo in the market.
In this case, they will follow Hypothesis Testing in-order to determine the success of a product in the market.
Where the probability of a product being unsuccessful in the market is taken as the Null Hypothesis and probability of a product being successful is taken as an Alternative Hypothesis.
By following the process of Hypothesis testing they will predict the success.
How to Calculate Hypothesis Testing?
Step 1) State the two hypotheses so that only one can be right, such that both events are mutually exclusive.
#Step 2) Now formulate an analysis plan, that will outline how the data will be evaluated.
Step 3) Now carry out the plan and physically analyze the sample dataset.
Step 4) Finally analyze the results and either accept or reject the null hypothesis.
Hypothesis testing P-value
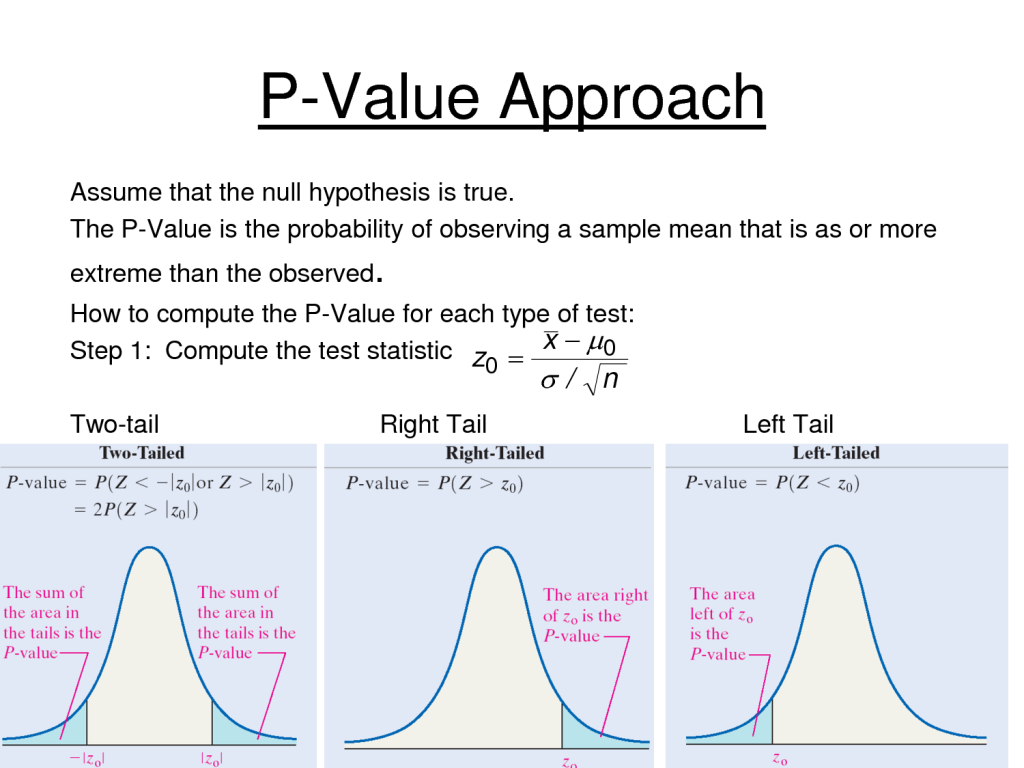
The p-value is the probability of getting the observed value of the test statistic, or a value with even greater evidence against H0 if the null hypothesis is actually true.
The p-value is the level of marginal significance within a statistical hypothesis test that represents the probability of a particular event occurring. p-value is used as an alternate method to reject points to provide the smallest level of significance at which the null hypothesis would be rejected. A smaller p-value means that there is stronger evidence to prove an alternative hypothesis.
P-value is the area or the region or the size of test statistical value.
Hypothesis testing p-value method
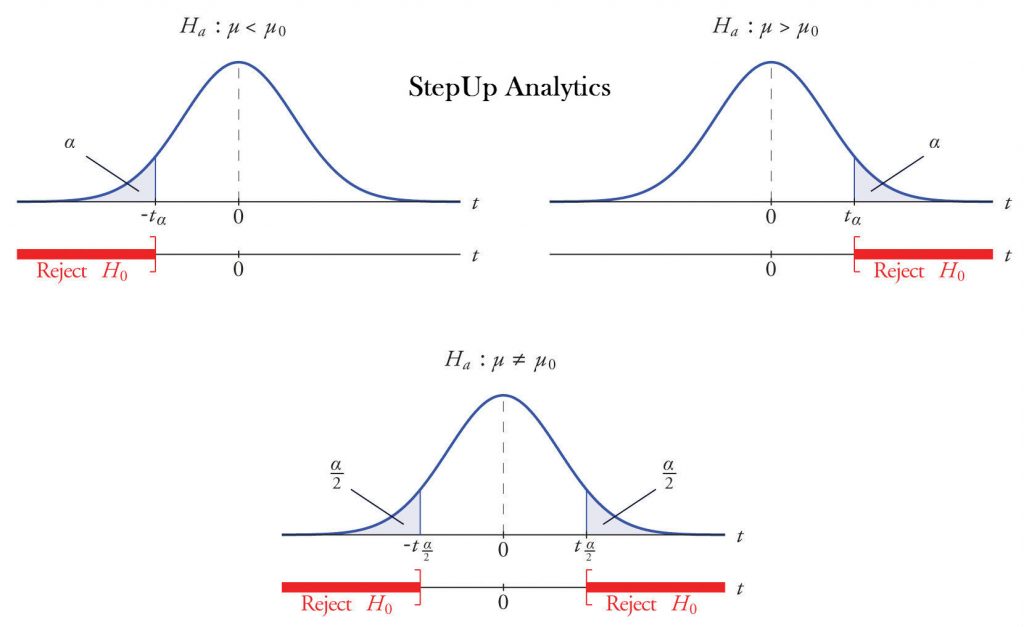
Suppose an investor claims that their investment portfolio's performance is nearly identical to that of the Standard & Poor's (S&P) 900 Index. In order to identify this, the investor performed a two-tailed test.
The null hypothesis states that the portfolio's returns are nearly equal to the S&P 900's returns over a specified period whereas the alternative hypothesis tells that the portfolio's returns and the S&P 900's returns are not equivalent. If the investor conducts a one-tailed test, the alternative hypothesis will tell that a portfolio's returns are either less than or greater than the S&P 900's returns.
One normally uses the p-value is 0.05. If the investor comes to the conclusion that the p-value is less than 0.05, there is strong evidence against the null hypothesis. Henceforth, the investor will reject the null hypothesis and accept the alternative hypothesis.
On the other hand, if the p-value is greater than 0.05, that indicates that there is weak evidence against the supposition, so the investor will fail to reject the null hypothesis.
If the investor determines that the p-value is 0.001, there is strong evidence against the null hypothesis, and the portfolio's returns and the S&P 900's returns may not be nearly the same.
In the above example, p-value helps the investor in determining the risk.
We hope you have understood the basics of the Hypothesis testing tutorial p-value method with examples in data science.
Interested in learning more? Then Get enroll with Prwatech for advanced Data science training institute in Bangalore with 100% placement assistance.
 There are two types of statistical hypotheses.
Null hypothesis (Ho): It is usually the hypothesis that the event will not occur.
The alternative hypothesis (H1 or Ha): It is a hypothesis that the event will occur.
Both the Null Hypothesis and Alternative Hypothesis must be mutually exclusive events.
There are two types of statistical hypotheses.
Null hypothesis (Ho): It is usually the hypothesis that the event will not occur.
The alternative hypothesis (H1 or Ha): It is a hypothesis that the event will occur.
Both the Null Hypothesis and Alternative Hypothesis must be mutually exclusive events.
 The null hypothesis states that the portfolio's returns are nearly equal to the S&P 900's returns over a specified period whereas the alternative hypothesis tells that the portfolio's returns and the S&P 900's returns are not equivalent. If the investor conducts a one-tailed test, the alternative hypothesis will tell that a portfolio's returns are either less than or greater than the S&P 900's returns.
One normally uses the p-value is 0.05. If the investor comes to the conclusion that the p-value is less than 0.05, there is strong evidence against the null hypothesis. Henceforth, the investor will reject the null hypothesis and accept the alternative hypothesis.
On the other hand, if the p-value is greater than 0.05, that indicates that there is weak evidence against the supposition, so the investor will fail to reject the null hypothesis.
If the investor determines that the p-value is 0.001, there is strong evidence against the null hypothesis, and the portfolio's returns and the S&P 900's returns may not be nearly the same.
In the above example, p-value helps the investor in determining the risk.
We hope you have understood the basics of the Hypothesis testing tutorial p-value method with examples in data science.
Interested in learning more? Then Get enroll with Prwatech for advanced Data science training institute in Bangalore with 100% placement assistance.
The null hypothesis states that the portfolio's returns are nearly equal to the S&P 900's returns over a specified period whereas the alternative hypothesis tells that the portfolio's returns and the S&P 900's returns are not equivalent. If the investor conducts a one-tailed test, the alternative hypothesis will tell that a portfolio's returns are either less than or greater than the S&P 900's returns.
One normally uses the p-value is 0.05. If the investor comes to the conclusion that the p-value is less than 0.05, there is strong evidence against the null hypothesis. Henceforth, the investor will reject the null hypothesis and accept the alternative hypothesis.
On the other hand, if the p-value is greater than 0.05, that indicates that there is weak evidence against the supposition, so the investor will fail to reject the null hypothesis.
If the investor determines that the p-value is 0.001, there is strong evidence against the null hypothesis, and the portfolio's returns and the S&P 900's returns may not be nearly the same.
In the above example, p-value helps the investor in determining the risk.
We hope you have understood the basics of the Hypothesis testing tutorial p-value method with examples in data science.
Interested in learning more? Then Get enroll with Prwatech for advanced Data science training institute in Bangalore with 100% placement assistance.

