Probability Density Function Tutorial, in this tutorial one, can learn everything about probability density function in Data Science. We Prwatech the Pioneers of Data Science Training are sharing information about Data Science to those Tech Enthusiasts who wanted to explore the technology and who wanted to become the expert in Data Science. Are you the one who is looking for the best platform which provides information about what is Probability density function? Or the one who is looking forward to taking the advanced Course from India’s Leading Data Science Training institute? Then you’ve landed on the Right Path.
Get Clear Understand of the Probability density function in Data Science with India’s Leading Data Science Training institute. The Below mentioned Tutorial will help to Understand the detailed information about Probability density function with examples, so Just Follow All the Tutorials of India’s Leading Best Data Science Training Institute in Bangalore and Be a Pro Data analyst.
What is the Probability Density Function?
Probability density function (PDF) is an expression that defines a probability distribution for a continuous random variable as opposed to a discrete random variable.
Probability Density Function (PDF), or density of a continuous random variable, is a function that describes the relative likelihood for this random variable to take on a given value.
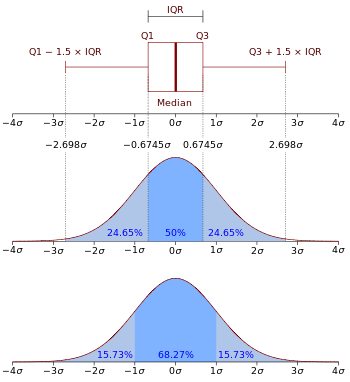
PDFs are utilized to gauge the risk of a particular security, like an individual stock or ETF. They are typically depicted over a graph, with a normal bell curve indicating neutral market risk, and a bell at either end indicating larger or lesser risk/reward. A bell at the right side of the curve suggests greater reward, but with lesser likelihood, while a bell over the left indicates lower risk and lower reward.
Investors should use PDFs as one of many tools to calculate the overall risk/reward in play in their portfolios.
Why we need a Probability Density Function?
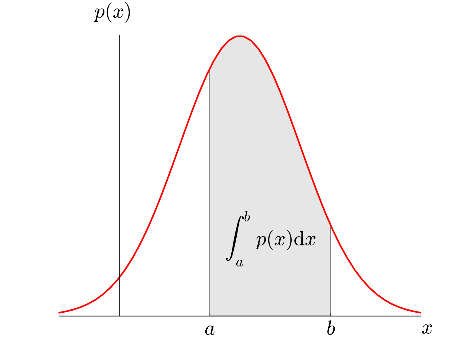
Let’s consider the above figure where we need to find the probability of rain that may occur in the month of July. According to the historical analysis of data, the rainfall lies between the limit ‘a’ and ‘b’.
It could be any value between a to b but we are interested in the nearest exact value.
Hence, we will use a Probability Density Function in order to calculate the same.
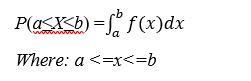
Probability density function formula
Probability density function Example
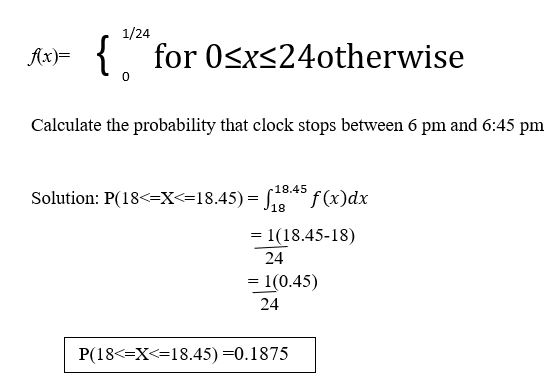
How to Calculate the Probability Density Function?
During the day, a clock at random stops once at any time. If x be the time when it stops and the PDF for x is given by:
In this Probability density function tutorial, we have covered all concepts of what is Probability density function, its use in data science, probability density function formula and how to calculate the probability density function with examples. This will get you a clear idea about the probability density function in Data Science.
Interested in learning more? Or do you want to become an expert in Data Science? get your Data science advanced course from Prwatech, India’s Leading Data science training institute in Bangalore.
We hope you liked our article on the probability density function tutorial. Share your feedback with your comments.
 PDFs are utilized to gauge the risk of a particular security, like an individual stock or ETF. They are typically depicted over a graph, with a normal bell curve indicating neutral market risk, and a bell at either end indicating larger or lesser risk/reward. A bell at the right side of the curve suggests greater reward, but with lesser likelihood, while a bell over the left indicates lower risk and lower reward.
Investors should use PDFs as one of many tools to calculate the overall risk/reward in play in their portfolios.
PDFs are utilized to gauge the risk of a particular security, like an individual stock or ETF. They are typically depicted over a graph, with a normal bell curve indicating neutral market risk, and a bell at either end indicating larger or lesser risk/reward. A bell at the right side of the curve suggests greater reward, but with lesser likelihood, while a bell over the left indicates lower risk and lower reward.
Investors should use PDFs as one of many tools to calculate the overall risk/reward in play in their portfolios.
 Let’s consider the above figure where we need to find the probability of rain that may occur in the month of July. According to the historical analysis of data, the rainfall lies between the limit ‘a’ and ‘b’.
It could be any value between a to b but we are interested in the nearest exact value.
Hence, we will use a Probability Density Function in order to calculate the same.
Let’s consider the above figure where we need to find the probability of rain that may occur in the month of July. According to the historical analysis of data, the rainfall lies between the limit ‘a’ and ‘b’.
It could be any value between a to b but we are interested in the nearest exact value.
Hence, we will use a Probability Density Function in order to calculate the same.
 In this Probability density function tutorial, we have covered all concepts of what is Probability density function, its use in data science, probability density function formula and how to calculate the probability density function with examples. This will get you a clear idea about the probability density function in Data Science.
Interested in learning more? Or do you want to become an expert in Data Science? get your Data science advanced course from Prwatech, India’s Leading Data science training institute in Bangalore.
We hope you liked our article on the probability density function tutorial. Share your feedback with your comments.
In this Probability density function tutorial, we have covered all concepts of what is Probability density function, its use in data science, probability density function formula and how to calculate the probability density function with examples. This will get you a clear idea about the probability density function in Data Science.
Interested in learning more? Or do you want to become an expert in Data Science? get your Data science advanced course from Prwatech, India’s Leading Data science training institute in Bangalore.
We hope you liked our article on the probability density function tutorial. Share your feedback with your comments.

