Welcome to the world of Python Pandas Tutorial for Beginners. Are you the one who is looking forward to knowing the introduction to python pandas? Or the one who is very keen to explore the Tutorials on Python Pandas with examples that are available? Then you’ve landed on the Right path which provides the standard information of Python Pandas Tutorial with examples by Prwatech.
The Below mentioned tutorial will help to Understand the detailed information about the introduction to python pandas, features of Python Pandas, Installation of Python Pandas, Data Structures, and Data frames in Python Pandas so Just Follow All the Tutorials of India’s Leading Best Python Training institute and Be a Pro python developer.
So, let's start the Python Pandas tutorial for Beginners.
What are Python Pandas?
Pandas is an open-source Python Library That provides high-performance data manipulation and analyzing tools using its powerful data structures.
The name Pandas comes from the word Panel Data – an Econometrics from Multidimensional data.
Pandas library is built on over Numpy, which means Pandas needs Numpy to operate.
provide an easy way to create, manipulate, and wrangle the data.
Pandas help us to perform the following operations:
1. Loading the Data
2. Preparing the Data
3. Manipulating the Data
4. Modeling the Data
5. Analyzing the Data
Python with Pandas is used in different fields including academic and commercial domains that include finance, economics, statistics, analytics, etc.
Features of Python Pandas
Tools for loading data into the in-memory data objects from different file formats.
Data alignment and integrated handling of missing data values.
Reshaping and pivoting the data set.
Label-based on slicing, indexing, and sub-setting of large data sets.
Columns from data-structures can be inserted and deleted.
Performing operations like groupBy over the dataset.
Installation of Python Pandas
For Mac OS:
Step1)Open the terminal
Step2)pip install pandas
For Windows user:
Step1) Go to the File menu
Step2) Go to settings
Step3) Go to Project
Step4) Go to project Interpreter
Step5) Click on the ‘+’ icon
Step6) Type pandas.
Step7) Select it and install it.
Step8) import pandas as n
Step9) Use it
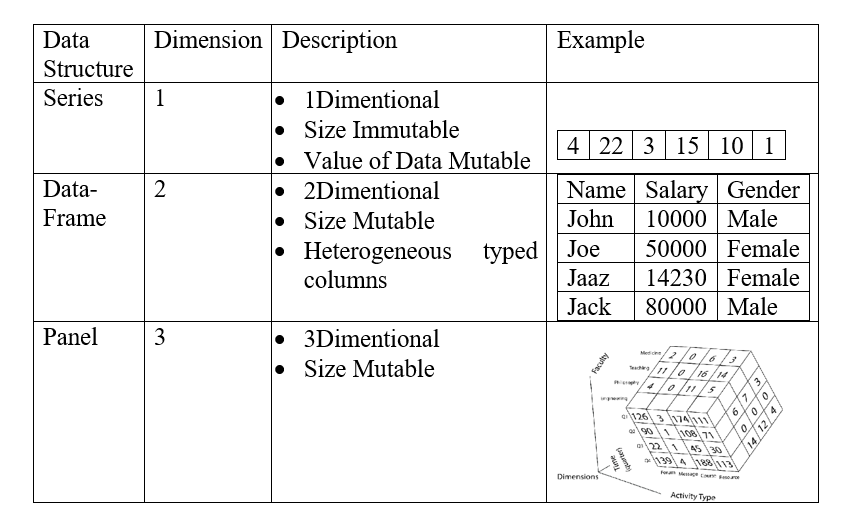
Data Structures in Python Pandas
Series
Data-Frames
Panel
Mutability:
All Pandas data structures are valued mutable and except Series, all are also size mutable. is a size immutable.
Series:
A Series is 1 Dimensional labeled array having the size Immutable and Value of Data Mutable.
Syntax) pandas.Series(data,index,dtype,copy)
data: it takes various forms like nD-array, list, constants
index: Index value must be unique
>dtype: It is for datatype
copy: It is used to copy the data. By default, its value is false
Array:
If data is from an array, then the index passed must be of the same length.
If no index is passed, then by default index will be range(n) where n is array length starting from zero,
i.e. [0,1,2,3…. range(len(array))-1].
Ex) import pandas as pad
import numpy as num
a=num.array([1,4,5,6,7])
s=pad.Series(a)
print s
Dictionary
A dictionary can be passed as an input and if no index is specified, then the dictionary keys are taken in a sorted order to construct its index. If the index is passed, the values in data corresponding to the labels present in the index will be pulled out.
Ex)import pandas as pad
import numpy as num
a= {‘a’: ‘add’, ‘s’: ‘sub’, ‘d’: ‘dvd’}
s=pad.Series(a)
print s
Constants
If data is a constant, then an index must be provided. The value will be repeated to match the length of the index.
Ex)import pandas as pad
import numpy as num
s=pad.Series(4,index=[0,1,2])
print s
Accessing Data from Series with Position
Ex) import pandas as pad
import numpy as num
a=num.array([1,4,5,6,7])
s=pad.Series(a)
print s[2]
Data frames in Python Pandas
It is a 2Dimentional array which is Size Mutable and Heterogeneously typed columns.
Syntax: pandas.DataFrame(data, index, column, dtype, copy)
Data: it takes values in various forms like an array, series, map, list, dictionary, constants, and also another DataFrame.
index: For the row labels, the Index is used for the resulting frame, it is Optional Default np.arrange(n) if no index is passed.
Column: In column labels, the optional default syntax is - np.arrange(n). It is only true if no index is passed.
Dtype: It denotes the datatype of each column.
Copy: It is used for copying of data, by default it is false.
DataFrames can be created using various inputs.
List:
Ex)import pandas as pad
data = [9,2,3,4,5]
df1 = pad.DataFrame(data)
print df
Dictionary:
Ex)import pandas as pad
import numpy as num
a= {‘a’: ‘add’, ‘s’: ‘sub’, ‘d’: ‘dvd’}
df=pad.DataFrame(a)
print df
Series:
Ex)import pandas as pad
import numpy as num
a= {[‘a’, ‘add’], [‘s’, ‘sub’], [‘d’, ‘dvd’]}
df=pad.Series(‘sr’, ‘opp’)
print df
Numpy n-dimensional array:
Ex) import pandas as pad
import numpy as num
a= [1,2,3,4,5]
s=pad.DataFrame(a)
print df
Another DataFrame:
Ex) import pandas as pad
import numpy as num
a= {‘a’: ‘add’, ‘s’: ‘sub’, ‘d’: ‘dvd’}
s=pad.DataFrame(a)
print s
Column additions:
Ex) import pandas as pad
d = {'one' : pad.Series([2, 3, 4], index=['a', 'b', 'c']),
'two' : pad.Series([2, 3, 4, 5], index=['a', 'b', 'c', 'd'])}
df = pad.DataFrame(d)
print ("Adding a new column by passing as Series:")
df['three']=pad.Series([100,200,300],index=['a','b','c'])
print df
print ("Adding a new column using the existing columns in DataFrame:")
df['four']=df['one']+df['three']
print df
Column Deletion:
It can be done using either del() or pop().
Ex) import pandas as pd
d = {'one' : pd.Series([2, 3, 4], index=['a', 'b', 'c']),
'two' : pd.Series([2, 3, 4, 5], index=['a', 'b', 'c', 'd']),
'three' : pd.Series([100,200,300], index=['a','b','c'])}
df = pd.DataFrame(d)
print ("Our dataframe is:")
print df
# using del function
print ("Deleting the first column using DEL function:")
del df['one']
print df
# using pop function
print ("Deleting another column using POP function:")
df.pop('two')
print df
Panel:
A panel is a 3D container of data elements. The term Panel data is been derived from econometrics and is partially responsible for the name pandas − pan(el)-da(ta)-s. The names for the 3 axes are deliberated to give some semantic meaning to describe operations involving a panel data. Items: axis zero, each item corresponds to a DataFrame contained inside. major_axis: axis one, it is the index (rows) of each of the DataFrames. minor_axis: axis two, it is the columns of each of the DataFrames.
Syntax) pandas.Panel(data, items, major_axis, minor_axis, dtype, copy)
Data: Data can be taken from various forms like an array, series, map, lists, dictionary, constants, and also another DataFrame.
Items: axis zero, each item corresponds to a DataFrame contained inside.
major_axis: axis one, it is the index (rows) of each of the DataFrames.
minor_axis: axis two, it is the columns of each of the DataFrames.
dtype: It describes the datatype of each column.
copy: copy the data. By default, its value is false.
How to Create Panel in Python Pandas?
A Panel can be created using multiple ways like:
From ndimentional array
Ex) import pandas as pad
import numpy as num
data = num.random.rand(6,8,1)
p = pd.Panel(data)
print p
o From dictionary of DataFrame
Ex) import pandas as pd
import numpy as np
data = {'Item1' : pd.DataFrame(np.random.randn(4, 3)),
'Item2' : pd.DataFrame(np.random.randn(4, 2))}
p = pd.Panel(data)
print p
Selecting the Data from Panel
o Using Items:
Ex) import pandas as pad
import numpy as np
data = {'Item1' : pad.DataFrame(np.random.randn(5, 3)),
'Item2' : pd.DataFrame(np.random.randn(5, 2))}
p = pd.Panel(data)
print p['Item1']
Using major_axis:
Ex) import pandas as pd
import numpy as np
data = {'Item1' : pd.DataFrame(np.random.randn(9, 3)),
'Item2' : pd.DataFrame(np.random.randn(9, 2))}
p = pd.Panel(data)
print p.major_xs(1)
Using minor_axis:
Ex) import pandas as pd
import numpy as np
data = {'Item1' : pd.DataFrame(np.random.randn(8, 3)),
'Item2' : pd.DataFrame(np.random.randn(8, 2))}
p = pd.Panel(data)
print p.minor_xs(1)
Series: Basic Functions
Name
Description
Example
Axes
Used to return the list of the labels of the series.
s = pd.Series(np.random.randn(9))
print s.axes
Empty
It returns the Boolean value about whether the Object is empty or not. True will indicate that the object is empty.
s = pd.Series(np.random.randn(9))
print s.empty
Ndim
It returns the number of dimensions of the object.
Ex) import pandas as pd
import numpy as np
#Create a Dictionary of series
d1 = {'Name':pd.Series(['Tomy','Jimy','Ricky','Viny','Steven','Smithen','Jacky',
'Lee','Dravid','Gaspery','Betin','Andru']),
'Age':pd.Series([22,23,26,21,30,29,23,34,40,30,51,46]), 'Rating':pd.Series([5.23,3.44,3.95,2.66,4.20,4.6,6.8,1.78,3.98,4.80,4.10,3.65])
}
#Create a DataFrame
df = pd.DataFrame(d)
Name
Description
Example
count()
Counts number of not null observations
print df.count()
sum()
Sums the values
print df.sum()
mean()
Finds mean of the values
print df.mean()
median()
Find medians of the values
print df.median()
mode()
Finds modes of the values
print df.mode()
std()
Finds standard deviation of the values
print df.std()
min()
Finds minimum value from given data
print df.min()
max()
Finds maximum value from given data
print df.max()
abs()
Finds absolute value
print df.abs()
prod()
Gives product of the values
print df.prod()
cumsum()
Gives the cumulative summation
print df.cumsum()
cumprod()
Gives the cumulative product
print df.cumprod()
Iterations in Pandas
The behavior of basic iteration over Pandas objects depends on its type. i.e. when iterating over a Series, it is regarded as array-like, and basic iteration displays the values.
In other data structures, like DataFrame and Panel, follow the dictionary like a convention of iterating over the keys of objects.
It returns iterator yielding each index value along with a series containing the data in each row.
for row_index,row in df.iterrows():
print row_index,row
itertuples()
It returns an iterator yielding a named tuple for each row in a DataFrame.
for row in df.itertuples():
print row
Pandas methods to work with textual data
Ex) import pandas as pdimport numpy as nps = pd.Series(['Tom', 'Dick', 'Harry', 'Allen', np.nan, '6234','SteveJobs'])
Name
Description
Example
lower()
Converts all characters into lower case
print s.str.lower()
upper()
Converts all characters into upper case
print s.str.upper()
len()
Displays total number of characters present in a string
print s.str.len()
strip()
Helps to strip whitespace(including newline) from each string in the Series from both the sides.
print s.str.strip()
split(‘ ’)
Splits each string according to given delimiter
print s.str.split(‘ ’)
cat(sep=‘ ’)
Concatenates the series elements with given separator.
print s.str.cat(sep=‘’)
get_dummies()
It returns the Data-Frame with One-Hot Encoded values.
print s.str.get_dummies()
contains(pattern)
Returns true if given pattern is present
print s.str.contains()
replace(a,b)
Replaces the value of a with b
print s.str.replace(‘@’,’$’)
repeat(value)
Repeats each element for the specific number of times
print s.str.repeat(2)
count(pattern)
Returns the count of particular element present
print s.str.count(‘s’)
startswith(pattern)
Returns true if string starts with the given pattern
print s.str.startswith(‘I’)
endswith(pattern)
Returns true if string ends with the given pattern
print s.str.endswith(‘m’)
find(pattern)
Returns first position of first occurrence
print s.str.find(‘r’)
findall(pattern)
Returns all occurrence of a substring
print s.str.findall(‘ra’)
swapcase
Swaps from lower to upper case or viz versa
print s.str.swapcase()
islower()
Returns true if all characters are in lower case
print s.str.islower()
isupper()
Returns true if all characters are in upper case
print s.str.upper()
isnumeric()
Returns true if all characters are numeric
print s.str.numeric()
Pandas - Window Statistics Functions
For working over numerical data, Pandas provide some variants like rolling, expanding, and exponentially moving weights for window statistics. Among these are some like sum, mean, median, variance, covariance, correlation, etc.
rolling() Function:
This function can be applied to a series of data. Specify window=n argument and apply an appropriate statistical function on top of it.
Ex) import pandas as pd
import numpy as np
df = pd.DataFrame(np.random.randn(10, 4),
index = pd.date_range('2/2/2022', periods=5),
columns = ['W', 'X', 'Y', 'Z'])
print df.rolling(window=4).mean()
Output) A B C D
2022-02-01 NaN NaN NaN NaN
2022-02-02 NaN NaN NaN NaN
2022-02-03 NaN NaN NaN NaN
2022-02-04 0.628267 -0.047040 -0.287467 -0.161110
2022-02-05 0.398233 0.003517 0.099126 -0.405565
Since the window size is 4, for first three elements there are nulls and from fourth the value will be the average of the n, n-1 and n-2 elements.
expanding() Function:
This function can be applied to a series of data. Specify the min_periods=n arguments and apply the appropriate statistical functions on top of it.
Ex) import pandas as pd
import numpy as np
df = pd.DataFrame(np.random.randn(10, 4),
index = pd.date_range('2/2/2022', periods=5),
columns = ['W', 'X', 'Y', 'Z'])
print df.expanding(min_periods=3).mean()
Output) A B C D
2022-02-01 NaN NaN NaN NaN
2022-02-02 NaN NaN NaN NaN
2022-02-03 NaN NaN NaN NaN
2022-02-04 0.628267 -0.047040 -0.287467 -0.161110
2022-02-05 0.398233 0.003517 0.099126 -0.40556
ewm() Function:
ewm is applied over a series of data. Specify any of com, span, halflife argument, and apply the appropriate statistical function on top of it. It assigns the weights exponentially.
Ex) import pandas as pd
import numpy as np
df = pd.DataFrame(np.random.randn(10, 4),
index = pd.date_range('2/2/2022', periods=5),
columns = ['W', 'X', 'Y', 'Z'])
print df.ewm(com=0.5).mean()
OutPu t A B C D
2022-02-01 1.088512 -0.650942 -2.547450 -0.566858
2022-02-02 0.865131 -0.453626 -1.137961 0.058747
2022-02-03 -0.132245 -0.807671 -0.308308 -1.491002
2022-02-04 1.084036 0.555444 -0.272119 0.480111
2022-02-05 0.425682 0.025511 0.239162 -0.153290
Window functions are majorly used while determining the trends within the data graphically by smoothing the curve. If there is a lot of variation in everyday data and lots of data points are available, then taking the samples and plotting is one approach and applying the window computations and plotting the graph on the results is another approach. By these methods, we can smooth the curve or the trend.
Data-Frames can be filtered in multiple ways just like where condition in sql.
print tips[tips['time'] == 'Dinner'].head(5)
GroupBy
This operation fetches the count of records in each group throughout a dataset.
print tips.groupby('sex').size()
Top N rows
Returns top n records
print tips.head(5)
Performing SQL join in Pandas
Pandas provide a single function ‘merge()’, as the entry point for all standard database join operations between Data-Frame objects.
Ex) import pandas as pd
left = pd.DataFrame({'id':[1,2,3,4,5], 'Name': ['Ali', 'Any',
'Amen', 'Arik', 'Amy'],
'subject_id':['sub1','sub2','sub4','sub6','sub5']})
right = pd.DataFrame({'id':[1,2,3,4,5],'Name': ['Bil', 'Briany',
'Bany', 'Brycy', 'Betten'],
'subject_id':['sub2','sub4','sub3','sub6','sub5']})
Name
Description
Example
left join
Displays common elements and elements of the 1st data frame