Sampling distribution of the sample mean tutorial, hunting for the best platform which provides information about Sampling distribution of the sample mean? Then welcome to the land of Sampling distribution of the sample mean on Data Science. In this tutorial one can explore about Sampling distribution of the sample mean in data science with examples and how to calculate Sampling distribution of the sample mean which were prepared by India’s Leading Data Science training institute professionals.
If you are the one who wanted to become the expert in Data Science? Or the one who wanted to explore the technology like a Pro under the certified experts with World-class classroom Training Environment, then start taking Data Science training from Prwatech who can help you to guide and offer excellent training with highly skilled expert trainers. Follow the below mentioned Sampling distribution of the sample mean tutorial and enhance your skills to become professional Data Scientist.
Sampling distribution of the sample mean Definition
Sample mean: Sample mean is the Arithmetic mean of a Small sample data drawn from a Population.
Sampling Distribution:
A sampling distribution acts as a frame of reference for the statistical decision-making process.
The sampling distribution allows us to identify whether, the given variability among all possible sample means, the one we observed is a common out-come or a rare outcome.
Sampling Distribution for Sample Mean Formula
The Sampling Distribution of the Mean is the mean of the population from where the items are sampled. If the population distribution is normal, then the sampling distribution of the mean is likely to be normal for the samples of all sizes.
Its mean is equal to the population mean, thus,
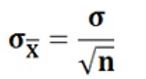
population standard deviation divided by the square root of the sample size is equal to the standard deviation of the sampling distribution of the mean, thus:
Where:
σ = population standard deviation
n = sample size
Why we need the Sampling distribution of the sample mean?
The sampling distribution of a statistic is a probability distribution based on a large number of samples of size from a given population.
Sampling distribution of the sample mean Example
There is n number of athletes participating in the Olympics. We want to know the average height of them. Instead of measuring all of the athletes, we randomly sample twenty athletes and use the sample mean to estimate the population mean.
Denote the sample mean of the twenty athletes as X1.
Suppose we take a separate sample of size twenty from the same.
Denote that sample mean as X2. Would X1 and X2 equal? Not necessarily.
What if we took another sample and found the mean? Consider now taking 5000 random samples of size twenty-five and recording all of the sample means.
We can take the 5000 sample means and create a histogram. This would give us a graphical idea of what the distribution of the sample means looks like.
The distribution of all of these sample means is the Sampling Distribution of the Sample Mean.
How to Calculate the Sampling distribution of the sample mean?
A rowing team consists of four rowers who weigh 154, 158, 162, and 166 pounds. Determine all possible random samples with the replacement of size 2 and compute the sample mean for each one. Use them to determine the probability distribution, the mean, and the standard deviation of the sample mean x̅.
The following table shows all possible samples with the replacement of size two, along with the mean of each:
1) Sample
Mean
154,154
154
154,158
156
154,162
158
154,166
162
2) Sample
Mean
158,154
156
158,158
158
158,162
164
158,166
164
3) Sample
Mean
162,154
158
162,158
160
162,162
162
162,166
164
4) Sample
Mean
162,154
158
162,158
160
162,162
162
162,166
164
5) Sample
Mean
166,154
160
166,158
162
166,162
164
166,166
166
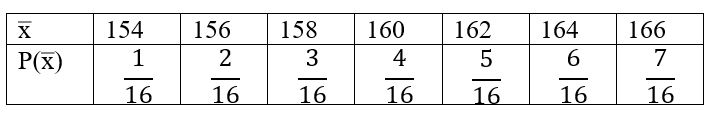
The table shows that there are seven possible values of the sample mean x̅. value x̅ =154 happens only one way (the rower weighing 154 pounds must be selected both times), as does the value x̅ =166, but the other values happen more than one way, hence are more likely to be observed than 154 and 166 are. Since the 16 samples are equally likely, we obtain the probability distribution of the sample mean just by counting:
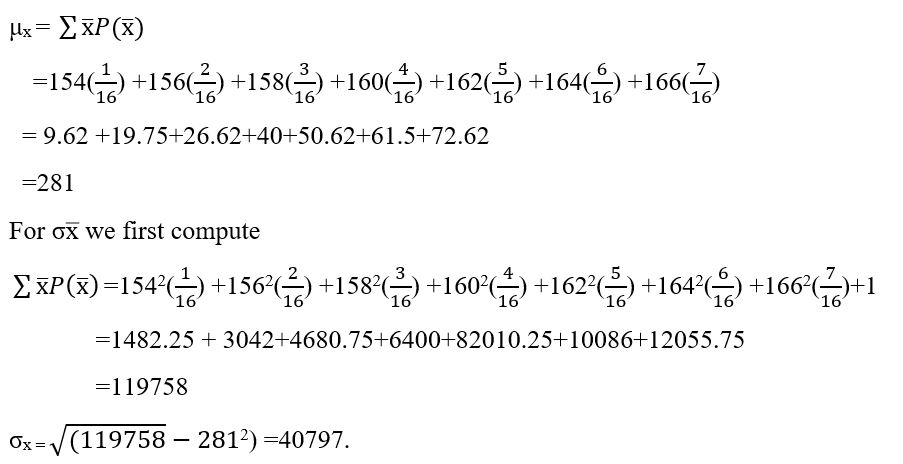
"The Mean and Standard Deviation of a Discrete Random Variable" for the mean and standard deviation of a discrete random variable to x̅. For μx we obtain.
We hope you have understood the basics of the Sampling Distribution of the sample mean tutorial and its formula with examples in data science. Interested in learning more? Then Get enroll with Prwatech for advanced Data science training institute in Bangalore with 100% placement assistance.
 population standard deviation divided by the square root of the sample size is equal to the standard deviation of the sampling distribution of the mean, thus:
 Where:
σ = population standard deviation
n = sample size
Where:
σ = population standard deviation
n = sample size
 "The Mean and Standard Deviation of a Discrete Random Variable" for the mean and standard deviation of a discrete random variable to x̅. For μx we obtain.
 We hope you have understood the basics of the Sampling Distribution of the sample mean tutorial and its formula with examples in data science. Interested in learning more? Then Get enroll with Prwatech for advanced Data science training institute in Bangalore with 100% placement assistance.

