Standard Deviation Tutorial: Welcome to Data Science Tutorial from Prwatech, In this one can learn about standard deviation in data science and how to calculate it with examples. Before we proceed, we recommend you to go through the previous blog in this series on how to calculate the sample variance.
Are you the one who is looking forward to knowing more about how to calculate standard deviation using python in Data science? or Are you the one who wants to become an expert Data Scientist? Then you have landed on the right path which provides advanced Data science training from Prwatech having highly skilled expert trainers with 100% best placement.
Standard Deviation Definition in Statistics:
Standard deviation in data science is the measure of the dispersion of a set of data from its mean. It measures the absolute variability of a distribution; the higher the dispersion is, the greater is the standard deviation will be and greater will be the magnitude of the deviation of the value from their mean.
Example of Standard Deviation:
EX) You need to measure the heights of your dogs (in millimeters):
The heights (at the shoulders) are 600mm, 470mm, 170mm, 430mm, and 300mm. Determine the Mean, the Variance, and the Standard Deviation.
Answer:Your first step is to find the Mean:
Mean=(600 + 470 + 170 + 430 + 300)/5
= 1970/5
= 394
Hence mean (average) height is 394 mm.
Let's plot this on the chart:
Now calculate each dog's difference from the Mean:To calculate the Variance, take each difference, square it, and then average the result:
Hence the Variance is 21,704
And Standard Deviation is just the square root of Variance, so:
Standard Deviation
σ = √21704
= 147.32...
= 147 (to the nearest mm)
And the good thing about Standard Deviation is that it is useful. Now we can show which heights are within one Standard Deviation (147mm) of the Mean:
Hence, using Standard Deviation we have a "standard" way of getting what is normal, and what is extra-large or extra small.
Why use Standard Deviation?
It is useful in comparing sets of data that may have the same mean but a different range.
How to Calculate Standard Deviation?
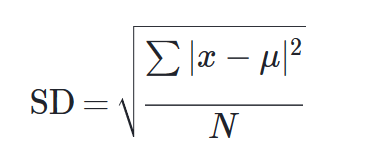
Step 1: Find the mean and for each data point, find the square of its distance to the mean.
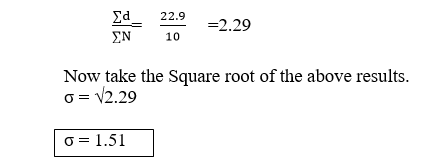
Step 2: Sum the values from Step 1 and divide by the number of data points, find its square root.
Standard Deviation Formula
Example:
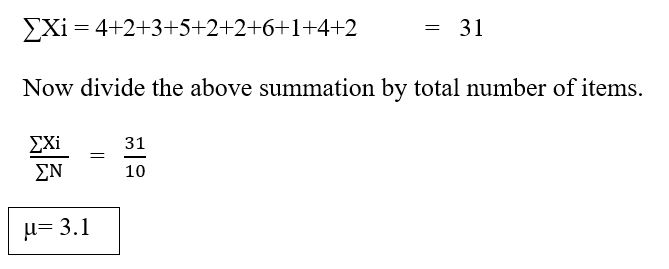
4
2
3
5
2
2
6
1
4
2
Perform Summation of all the items in the dataset:Now Subtract the above result from every item
4-3.1
2-3.1
3-3.1
5-3.1
2-3.1
2-3.1
6-3.1
1-3.1
4-3.1
2-3.1
0.9
-1.1
-0.1
1.9
-1.1
-1.1
2.9
-2.1
0.9
-1.1
Now Perform Squares on each of the above values:
0.81
1.21
0.01
3.61
1.21
1.21
8.41
4.41
0.81
1.21
Ready to take the first step towards a career in Data Science? Or if you are considering a career in Data Science. Make your dream come true by choosing India’s largest Data Science Training Institute in Bangalore which consists of highly skilled expert trainers.
In this Standard deviation tutorial, we have covered concepts of what is standard deviation, its use in data science, standard deviation formula and how to calculate the standard deviation with examples. This will get you a clear idea about the Standard deviation in Data Science.
We hope you liked our article on the Standard deviation tutorial. Share your feedback with your comments.
 The heights (at the shoulders) are 600mm, 470mm, 170mm, 430mm, and 300mm. Determine the Mean, the Variance, and the Standard Deviation.
Answer:
Your first step is to find the Mean:
Mean=(600 + 470 + 170 + 430 + 300)/5
The heights (at the shoulders) are 600mm, 470mm, 170mm, 430mm, and 300mm. Determine the Mean, the Variance, and the Standard Deviation.
Answer:
Your first step is to find the Mean:
Mean=(600 + 470 + 170 + 430 + 300)/5
 Now calculate each dog's difference from the Mean:
 To calculate the Variance, take each difference, square it, and then average the result:
Hence the Variance is 21,704
And Standard Deviation is just the square root of Variance, so:
Standard Deviation
σ = √21704
= 147.32...
= 147 (to the nearest mm)
And the good thing about Standard Deviation is that it is useful. Now we can show which heights are within one Standard Deviation (147mm) of the Mean:
To calculate the Variance, take each difference, square it, and then average the result:
Hence the Variance is 21,704
And Standard Deviation is just the square root of Variance, so:
Standard Deviation
σ = √21704
= 147.32...
= 147 (to the nearest mm)
And the good thing about Standard Deviation is that it is useful. Now we can show which heights are within one Standard Deviation (147mm) of the Mean:
 Hence, using Standard Deviation we have a "standard" way of getting what is normal, and what is extra-large or extra small.
 Now Subtract the above result from every item