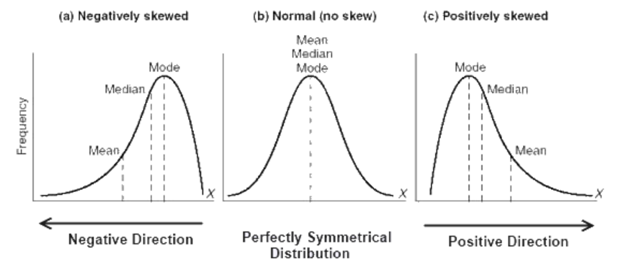
Choosing the Right Measure of Central Tendency
Mean: Considered as a average of a dataset.
Median: The middle vale of ordered dataset.
Mode: It is known as the most common value in a dataset.
Measures of Variability
Range: the difference between a dataset’s highest and lowest value.
Variance (σ2): determines how distributed a collection of data is in comparison to the mean.
Standard Deviation (σ): The square root of variance is a representation of how spread out numbers are in a data set.
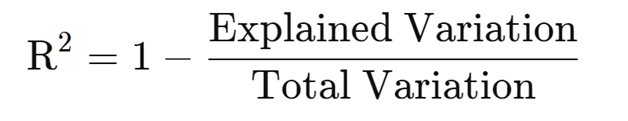
Z-score: determines how far a data point is from the mean in standard deviations.R-Squared: Only useful for simple linear regression.
Measurements of Relationships between Variables
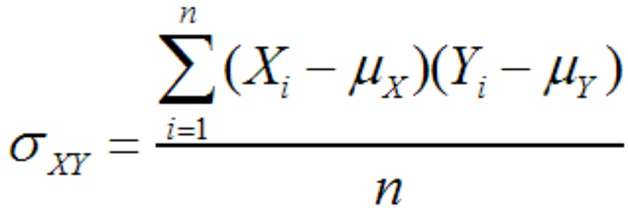
Covariance: Measures the variance between two (or more) variables. If it’s positive then they tend to move in the same direction, if it’s negative then they tend to move in opposite directions, and if they’re zero, they have no relation to each other.
The Center’s Measures
Mean: Mean is the average of the sum of all the values in a sample
Median: The Median is a measure of the sample set’s core value.
Mode: Mode is the most frequently occurring value in the sample collection..
You may use descriptive analysis to look at the mean, standard deviation, minimum, and maximum values for each variable in the sample data set.
Mean = (110+110+93+96+90+110+110+110)/8 = 103.625
The mpg for 8 cars: 21,21,21.3,22.8,23,23,23,23
Median = (22.8+23 )/2 = 22.9
- Range: This is a metric that describes how far apart the values in a data set are.
- Inter Quartile Range (IQR): This is a measure of variability dependent on quartile division of a data set
- .Variance: This term refers to the amount by which a random variable deviates from its predicted value.
- Deviation is the deviation of each factor from the mean
- Population Variance is the arithmetic mean of the squared deviations
- Sample Variance is the sum of squared deviations from the mean.
- Standard Deviation: It’s a metric for how far a collection of data deviates from its mean..

