Applications of Parameters
Get Started with Parameters, in this Tutorial one, you can learn how to use tableau and data types of tableau. Are you the one who is looking for the best platform which provides information about how to get Start with Tableau? Or the one who is looking forward to taking the advanced Certification Course from India’s Leading Tableau Training in Bangalore? Then you’ve landed on the Right Path.
The Below mentioned Tutorial will help to Understand the detailed information about aspects and applications of parameters, so just follow all the tutorials of India’s leading Best Tableau Training institute in Bangalore and Be a Pro Tableau Developer.
Let’s explore some more aspects and applications of parameters. Here, we have used Sample EU Superstore Data which is provided by Tableau by default.
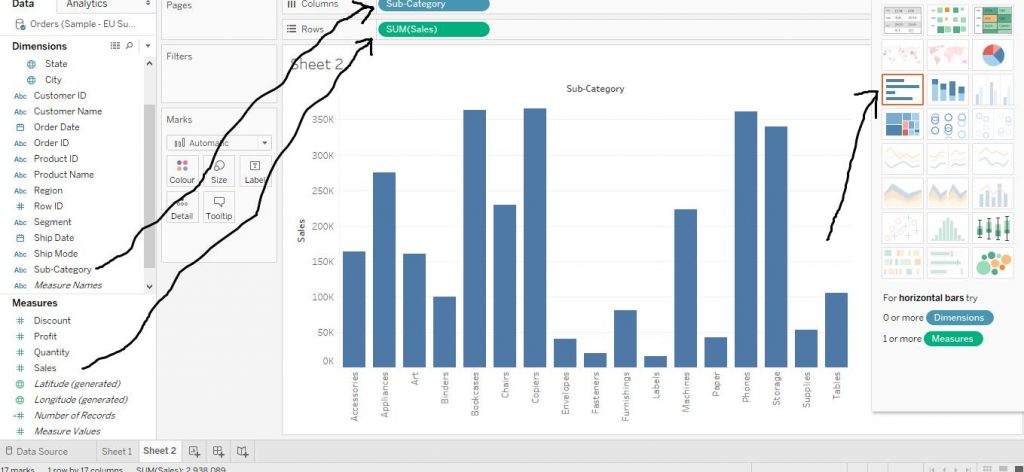
Firstly, let’s make a bar graph by dragging a dimensions variable (here we have chosen sub category) to Columns shelf and a Measures variable (here we have chosen Sales) to Rows shelf. Then from Show Me section, click on Bars to make a bar chart. How to create Bar Chart has already been taught. Refer to the chapter for more details. The arrows in the diagram below show the step.
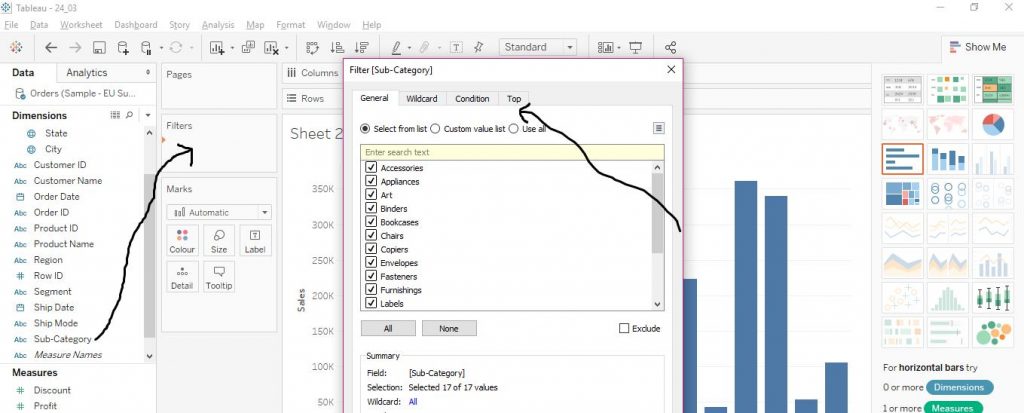
Now drag the variable Sub Category to the Filters section. A window would appear. Click on ‘Top’ menu. The arrows in the diagram below show the step.
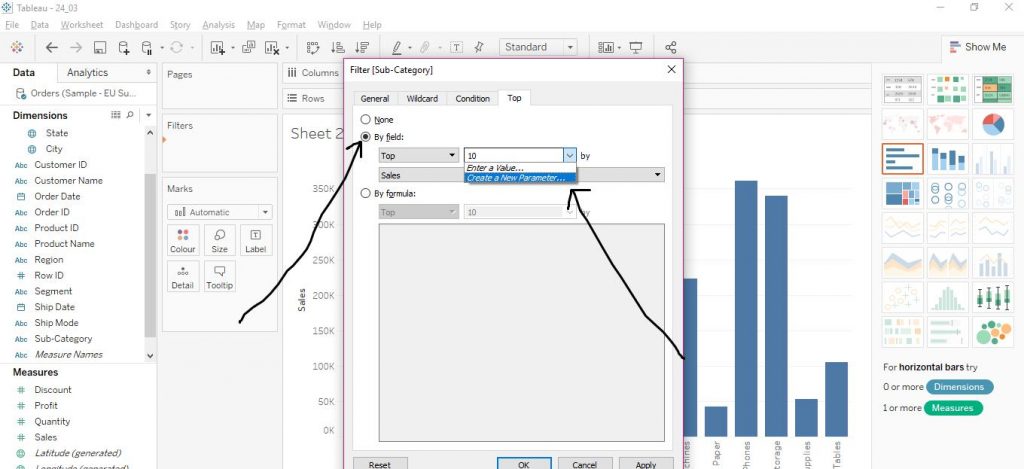
Now, select By field. Click on Top. Then click on Create a New Parameter. The arrows in the diagram below explain the step.
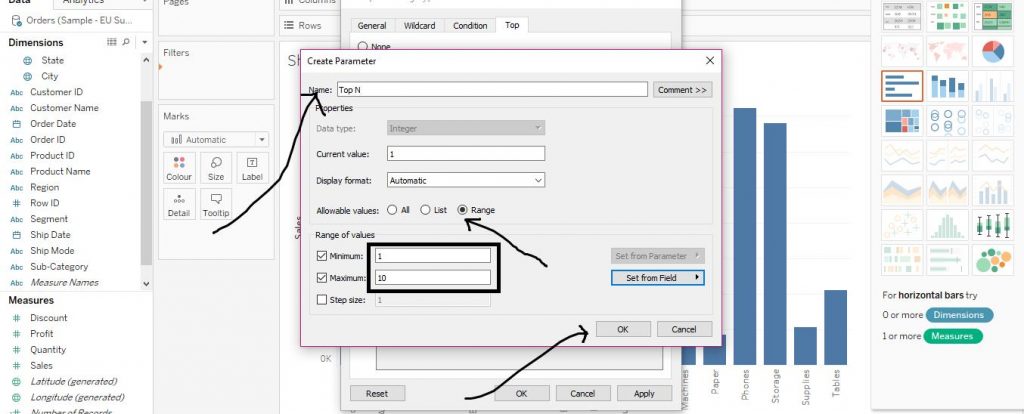
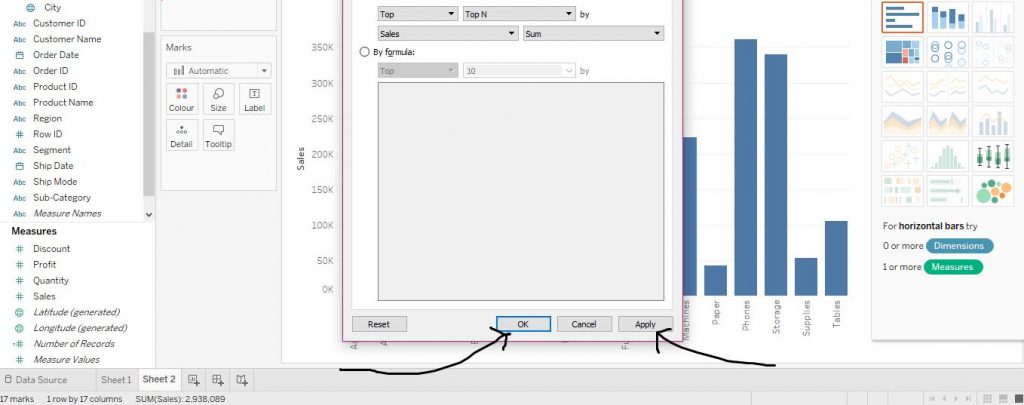
On this new window, put a name, here, we have put it as Top N. Then select Allowable values as Range. Put Minimum as 1 and Maximum as 10. Click on OK.The arrows in the diagram below explain the step.
Click on Apply and then click on OK as shown in the diagram below.
The parameter Top N gets created and we can change the top N values by moving the slider as shown in the diagram below and modify the visualisations as per requirement.
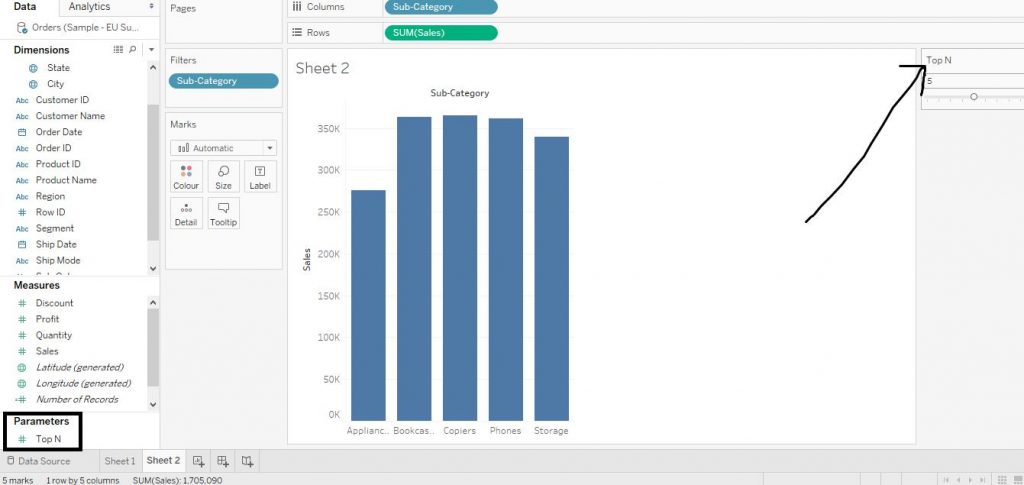
This parameter would help us to see the visualisations of Top N subcategory’s performance as per sales.
Now if you want to highlight the top N subcategory’s performance among all the sub categories as per sales rather than just showing only top N subcategories, we need to create a set.
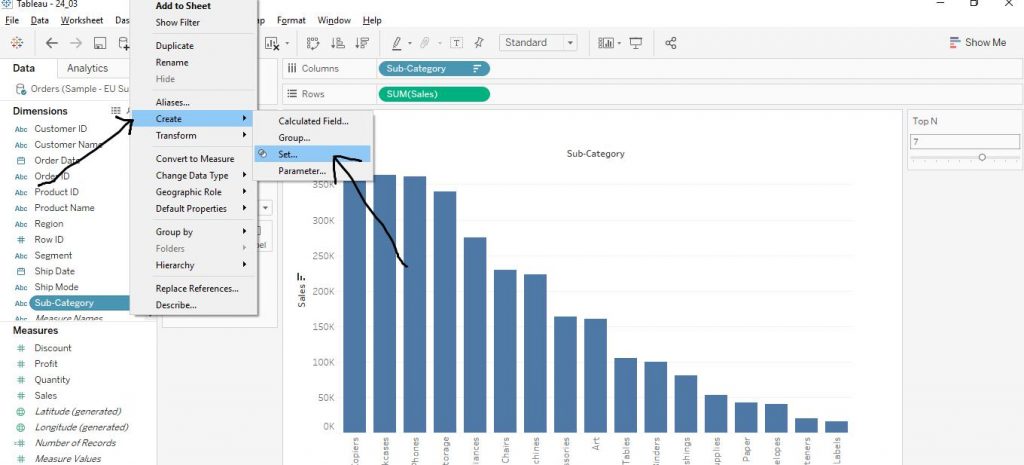
Right click on Sub Category and click on Create. Then click on Set. The arrows in the diagram below demonstrate the process.
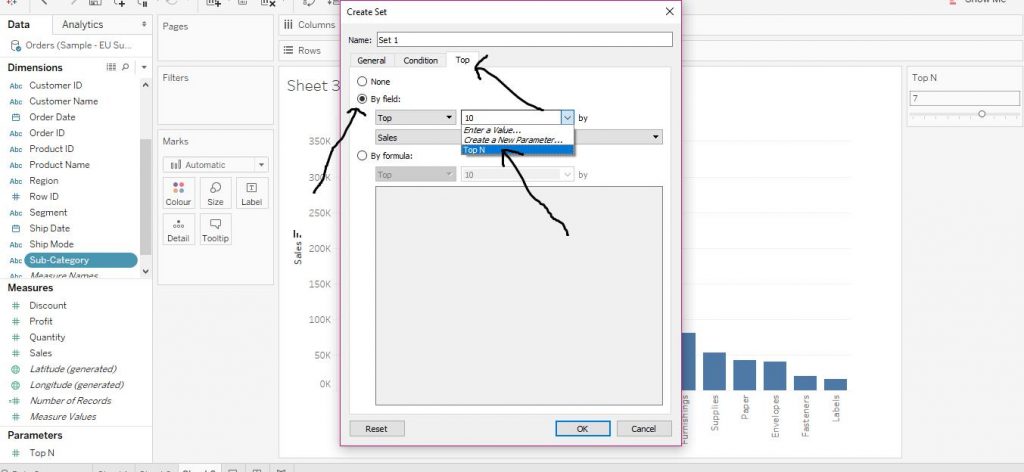
Again, click on Top. Then click on By field option. From the drop down menu, click on the parameter which we have created, i.e., Top N. Click on OK. The arrows in the diagram below describe the step.
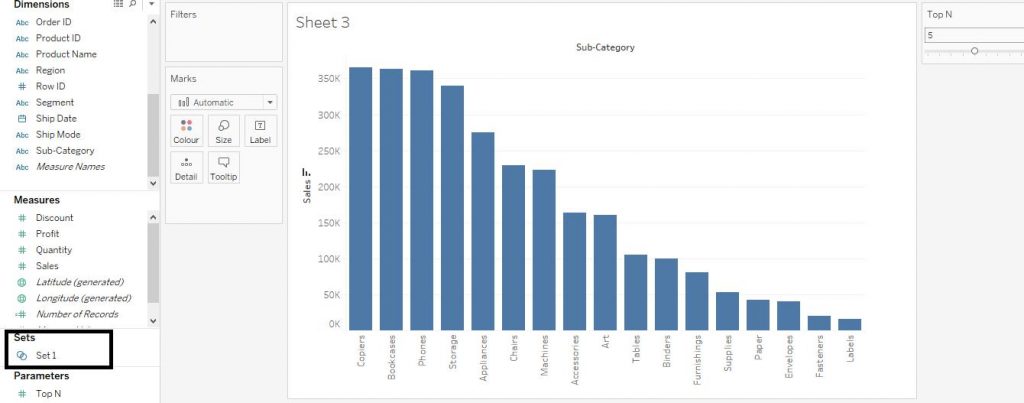
The set,Set 1 gets creat under the Sets section below Measures in the left hand side of the window. The diagram below shoes the same.
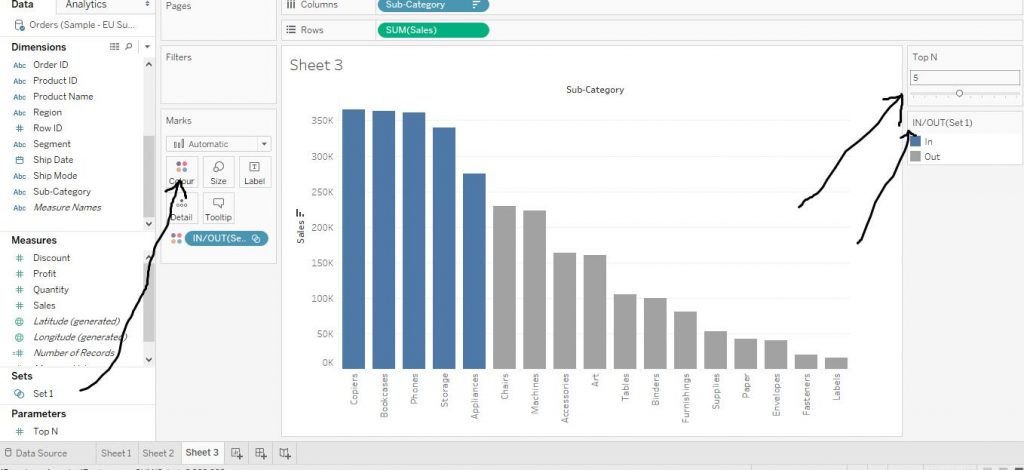
Now drag Set 1 to Colour in the Marks card and change the Top N values to highlight those very sub categories. The arrows in the diagram given below demonstrate the step.
This is the detail information of about applications of parameters in tableau. I hope you understand our applications of parameters tutorial and will helpful to you. If you have any queries, mention them in below comment section. If you wish to master in Tableau, Get trained for Tableau course by Prwatech, India’s largest E-learning Platform.

