Tableau Bar Chart
Tableau Bar Chart Tutorial
Tableau Bar Chart Tutorial, in this Tutorial one, you can learn about Bar Chart in Tableau. Are you the one who is looking for the best platform which provides information about Bar Chart in Tableau and its different types? Or the one who is looking forward to taking the advanced Certification Course from India’s Leading Tableau Training Institute? Then you’ve landed on the Right Path.
The Below mentioned Tutorial will help to Understand the detailed information about types of bar charts in tableau. So just follow all the tutorials of India’s leading Best Tableau Training institute in Bangalore and Be a Pro Tableau Developer.
Bar Chart in Tableau
A bar chart or bar graph is used to represent category data of a dataset. The length of the bars is proportionate to the values of the each category. This provides an understanding of the data graphically. The bars may be either plotted horizontally or vertically. A vertical bar chart is also known as column chart. A bar chart helps in portraying comparisons among discrete categories.
Bar charts arranged from the highest to the lowest frequency are also referred to as Pareto charts. Bar charts can also be utilised for more complex comparisons of data with stacked bar charts and grouped bar charts. In a grouped bar chart, there are two or more bars for each categorical group. The bars are color-coded in order to characterise a specific group. The stacked bar graph stacks bars that represent different groups of categories on top of each other. The height of the bar depicts the joint result of the groups.
Types of Bar Charts in Tableau
Let’s get started and explore the different types of bar charts that can be created on Tableau. We are using the Sample – EU Superstore dataset provided by the software itself.
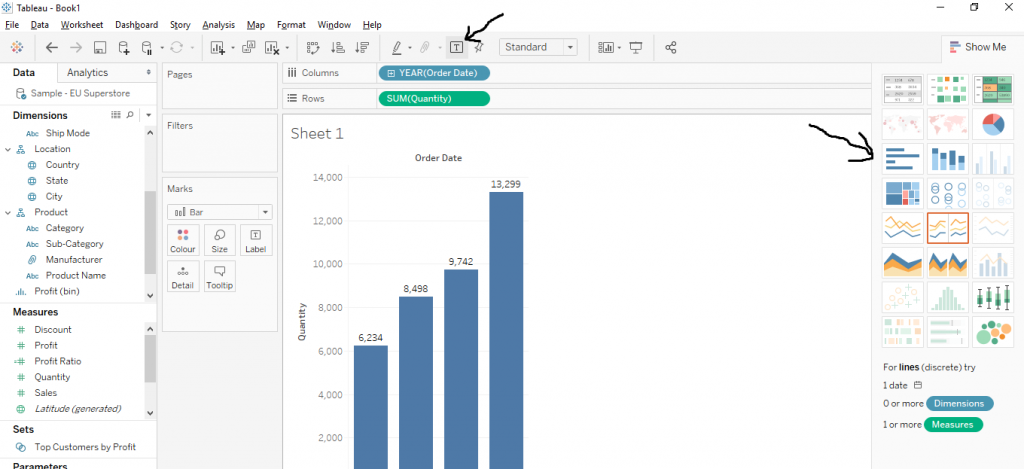
Basic Bar Graph
From the Dimensions section, drag the ‘Order Date’ which is date format to the Columns and there after drag ‘Quantity’ from the Measures section to the Rows. From the ‘Show Me’ panel click on the horizontal bars as shown by the arrow and then flip the graph to make the vertical bars. Then add labels to it which would depict the values on top of the bars as shown by the arrow in the diagram below.
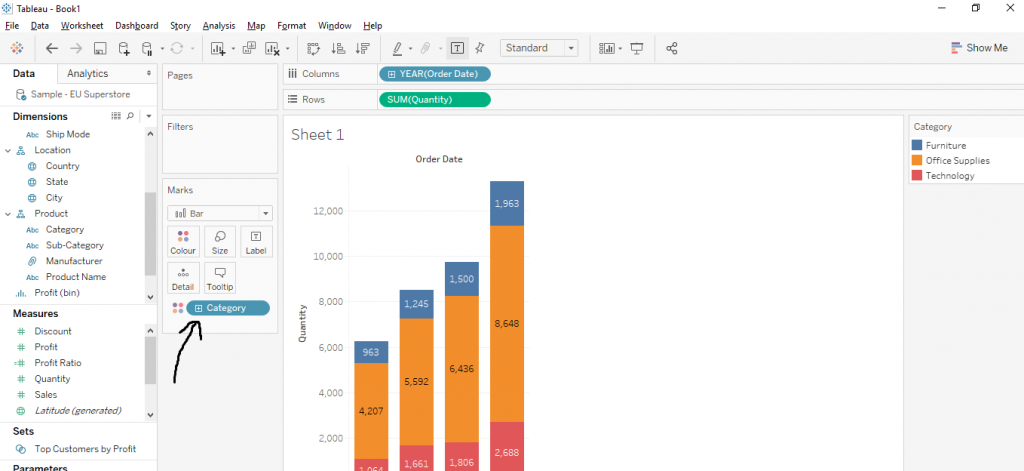
Stacked Bar Chart
A stacked bar graph allows part-to-whole comparisons across categories or over time. Each bar in the graph represents a whole quantitative value, and segments in the bar represent different categories or part of the entire value. Different colours are used to demonstrate the different groups in the bar.
Now in the above diagram, drag ‘Category’ from Dimensions section to the ‘Colour’ in the Marks section as shown by the arrow. The stacks would form on the basis of the category on the bars. The diagram below explains the same.
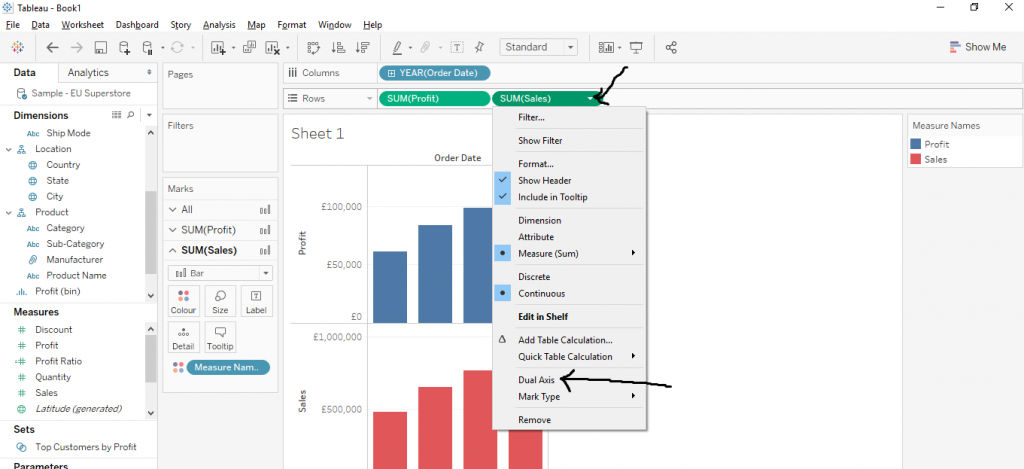
Bar within Bar Charts
Drag another Measure to the Rows in the bar chart. Another Bar Chart will be created below it with the same dimension. Now click on the little arrow on the second type of measure in the Rows as shown by the arrow. Then click on ‘Dual Axis’ from the list as shown in the diagram below.
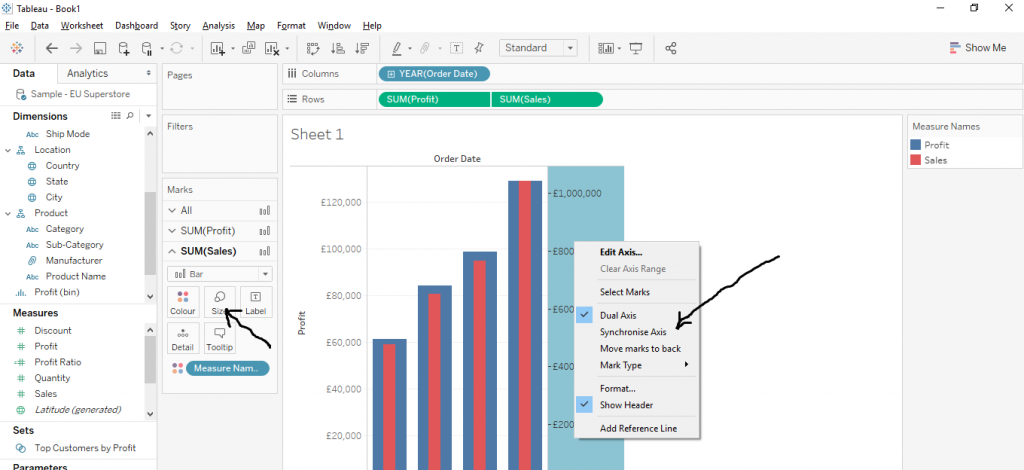
The Dual Axis Chart will be created. Then click on the second measure in Rows and decrease the size from the ‘Marks’ section as depicted by the arrow. Again, for better understanding, right click on the axis on the right hand side and click on ‘Synchronise Axis’ as shown by the arrow in the diagram below.
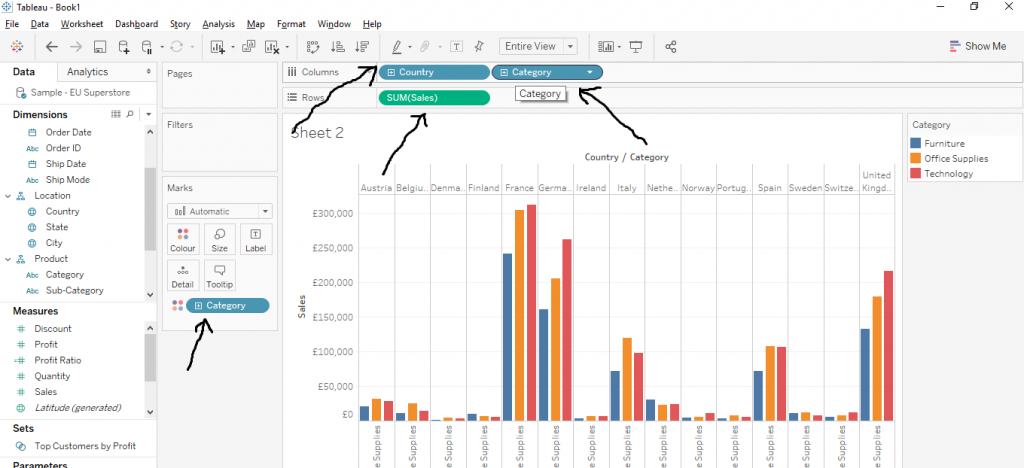
Side by Side Bars
Side by Side bar chart focuses on the sub-category wise comparison on the second dimension. Drag two different variables from the ‘Dimensions’ to the Columns and then drag a variable from Measures to the Rows and make the bar chart. Also, for better readability, drag the sub category variable type to the ‘Colour’ in the Marks section. The figure below demonstrates the same.
I hope you understand our Tableau Bar Chart tutorial and it is helpful to you. If you have any queries, mention them in below comment section. If you wish to master in Tableau, Get trained for Tableau course by Prwatech, India’s largest E-learning Platform.


