Ranking using Calculated Field
How to use the rank function in Tableau
Tableau Installation Tutorial for Beginners, are you looking for the information of tableau server installation steps under tableau course? Or the one who is casually glancing for the best platform which is providing information on how to install tableau software for beginners? Then you’ve landed on the Right Platform which is packed with tons of tutorials of installation of tableau. Follow the below mentioned Tableau Installation tutorial for Beginners which were originally designed by the world-class Trainers of Tableau Training institute Professionals.
If you are the one who is a hunger to become the certified Pro Tableau Developer? Or the one who is looking for the best tableau Training institute which offering advanced tutorials and tableau certification course to all the tech enthusiasts who are eager to learn the technology from starting Level to Advanced Level.
Ranking is referred to as the position in a hierarchy. It is basically relative in nature.Finding ranks is one of the very important aspects of analytics. Rankings help in identifying the performance of the variables and thus help in prioritizing business actions and taking important business decisions.
Let’s explore how to find rankings in Tableau. Here, we have used Sample EU Superstore data which is provided by Tableau by default.
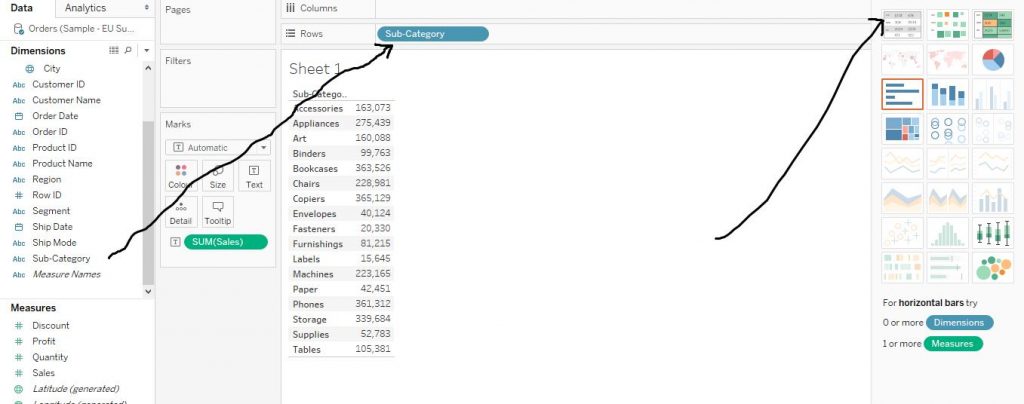
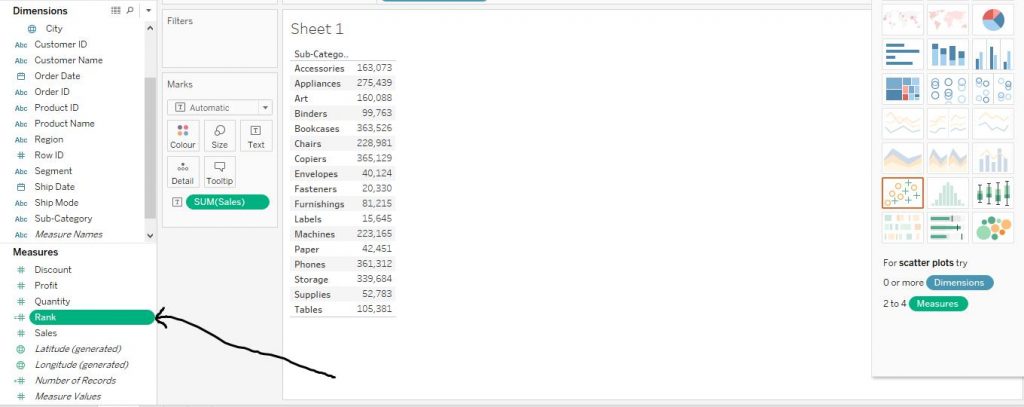
First, let us make a Text Tables Chart. Drag a Dimensions variable (here we have chosen Sub Category) to the Rows shelf and then drag a Measures variable (here we have selected Sales) to the Columns shelf. Then from Show Me section, click on Text Tables Chart in order to make the chart. The arrows in the diagram below help in understanding the step. We have already taught how to make Text Table Chart. Please refer to the chapter for more details and customization.
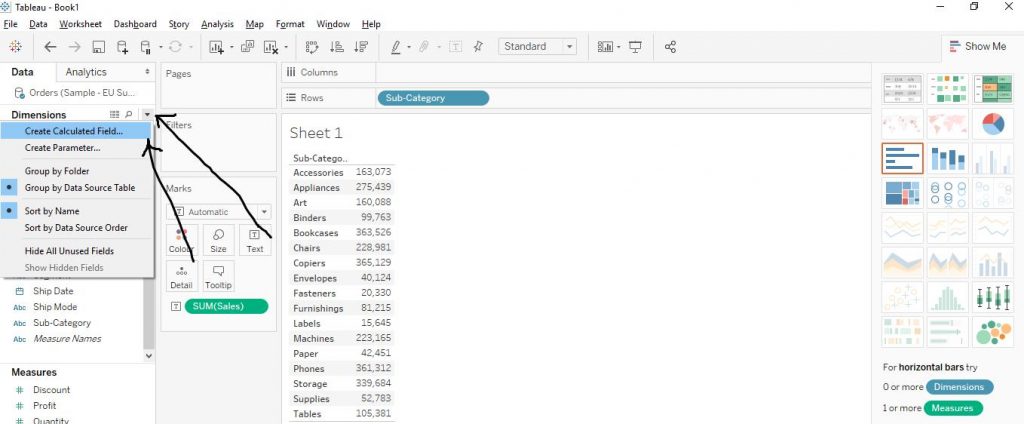
Now in order to find the ranks, we have to make a Calculated Field. We have already covered how to make Calculated Field. Please refer to the chapter for more details. However we would be brushing up the same again in this chapter.
Click on the little arrow beside Dimensions and then click on Create Calculated Field. The arrows in the diagram below show the step.
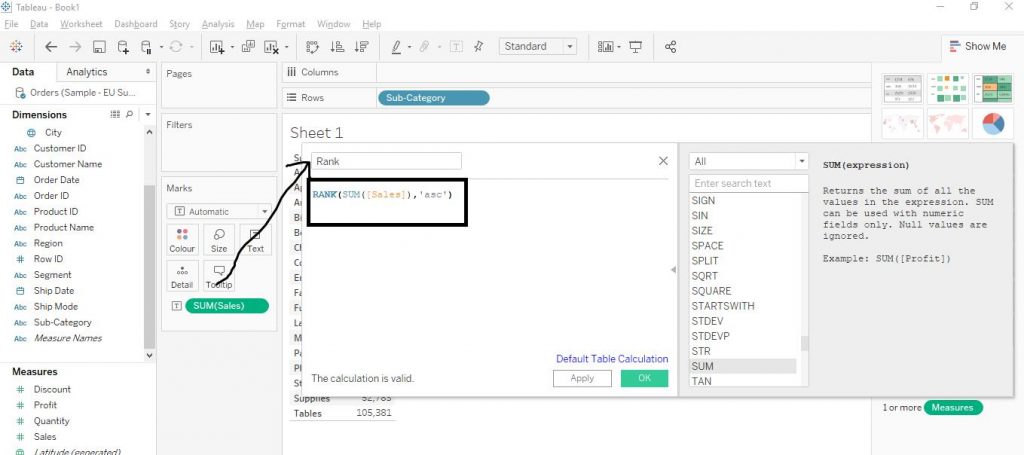
Now in the new window which appears, give a name of the Calculated Field (here, we have put the name as Rank). Then write the code as shown below in the diagram and choose the order as per requirement; ‘asc’ for ascending order and ‘desc’ for descending order. Here we have chosen the ascending order. Then click on Apply and further click on OK.
The Calculated Field ‘Rank’ gets created in the Measures section as shown by the arrow in the diagram given below.
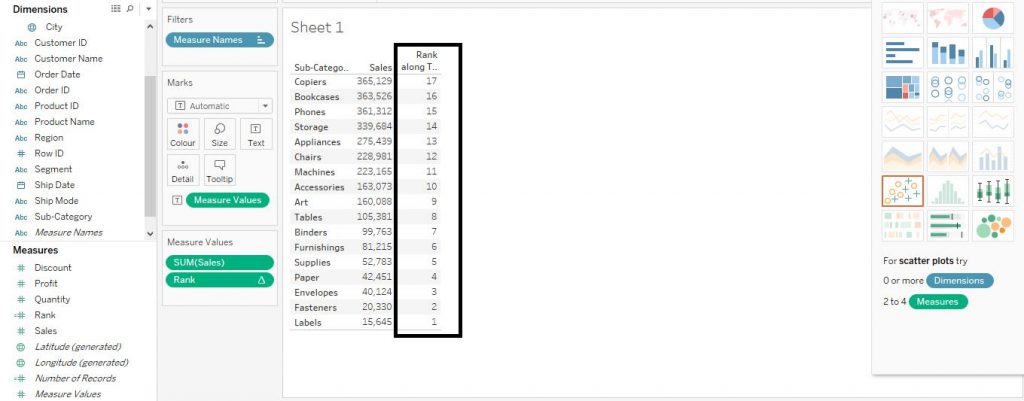
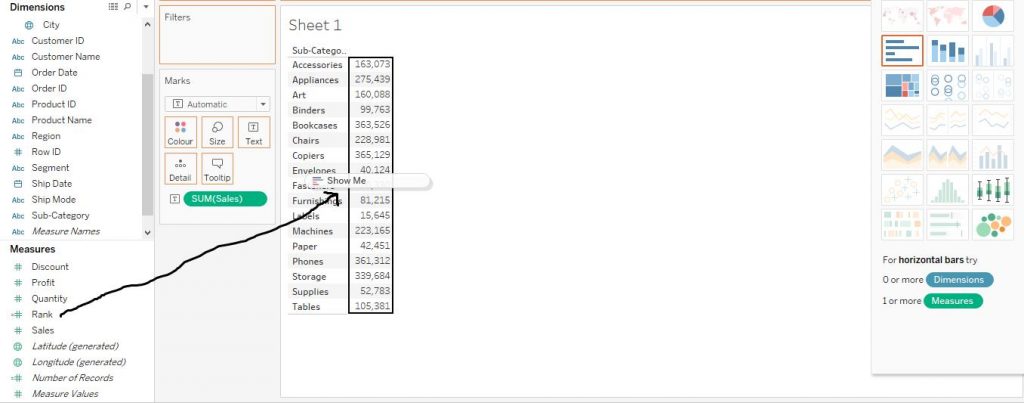
Now drag the Calculated Field ‘Rank’ to the Text Tables Chart as shown by the arrow in the diagram below in order to add the Rank Column in the chart.
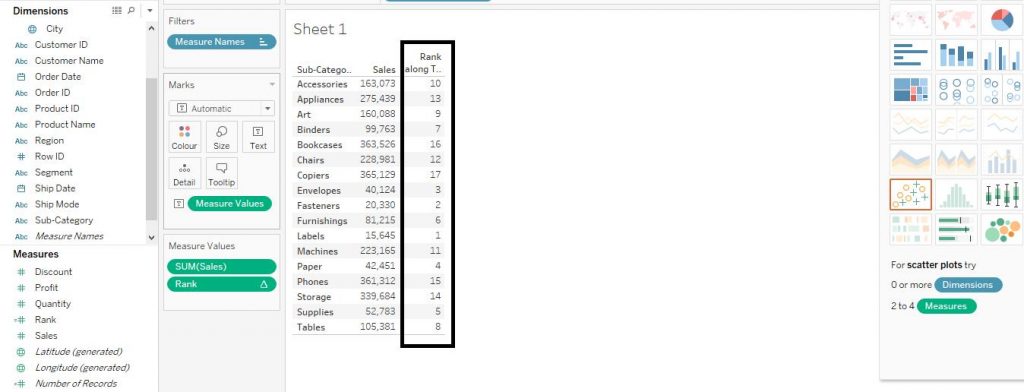
The Rank gets added as one more column in Text Table Chart which we have created. The diagram given below helps in understanding the following step.
Again, we have sorted the Rank column in descending order to enhance the readability of the graph.Click on the Rank header. From the window which appears, click on sort descending icon. The diagram below explains the step.
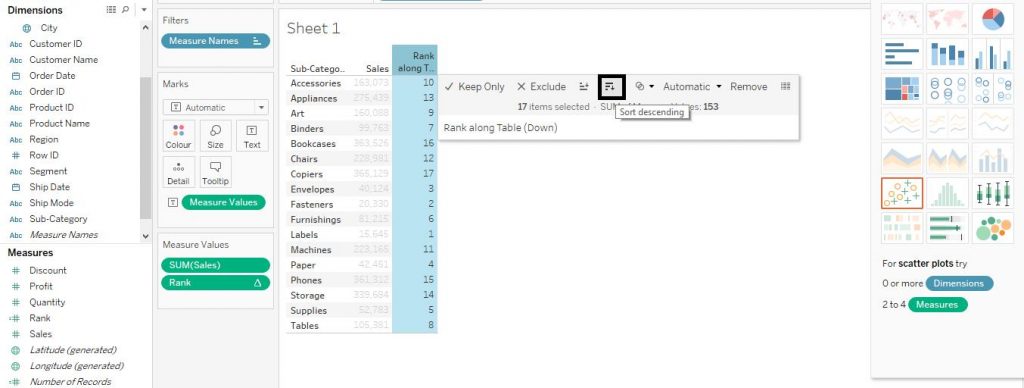
Finally the ranks get sorted in descending order as shown in the diagram given below.