How Forecasting Works in Tableau
Tableau Forecasting Tutorial, in this Tutorial one, you can learn about Forecasting in Tableau. Are you the one who is looking for the best platform which provides information about Forecasting in Tableau and its different types? Or the one who is looking forward to taking the advanced Certification Course from India’s Leading Tableau Training Institute? Then you’ve landed on the Right Path.
Forecasting is the method of estimation of the future by taking into account the past and present data.It helps in the determination of direction of future trends. Forecasting helps in planning of business actions and create budget to cover the uncertainties as much as possible. Tableau uses exponential smoothing method for forecasting purpose.
Let’s see how to make forecasts in Tableau. Here, we have used Sample EU Superstore data which is provided by Tableau by default.
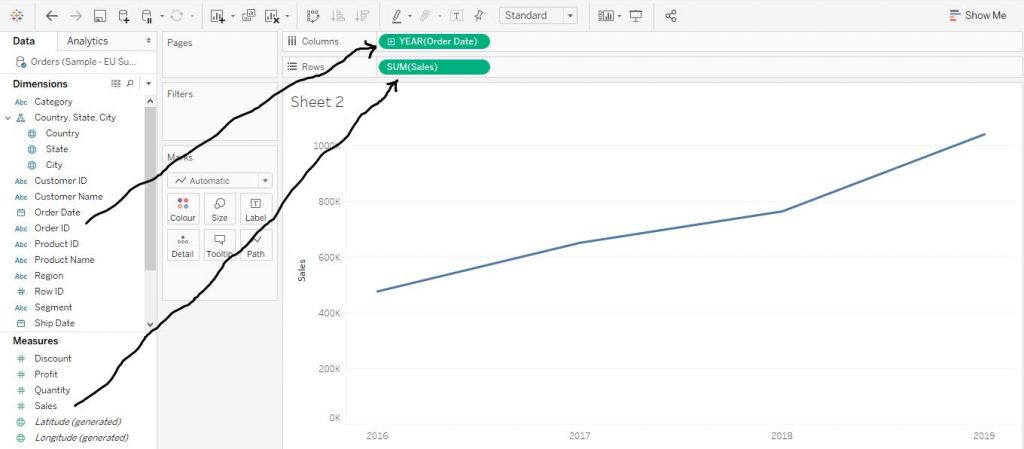
Drag the variable Order Date from Dimension section to Columns shelf. Also, drag the variable Sales from Measures section to Rows shelf. Now from Show Me section, click on lines chart to create a line chart as shown by the arrows in the diagram given below.
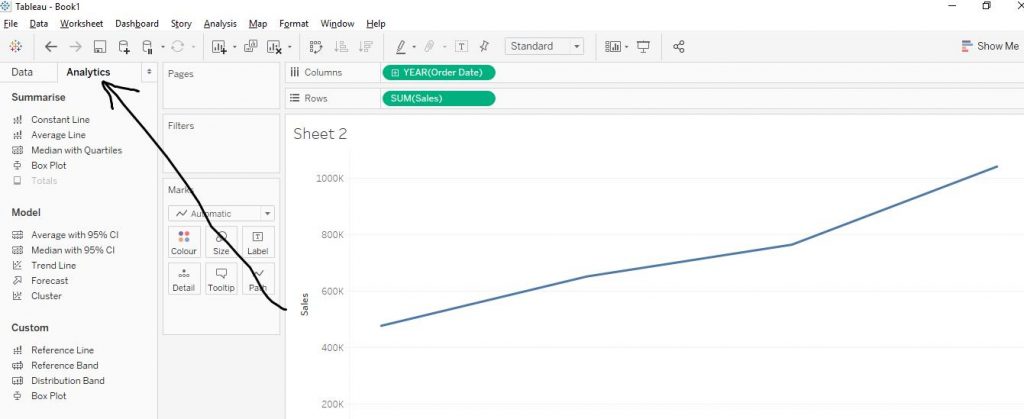
move on to Analytics section as shown by the arrow in the diagram.
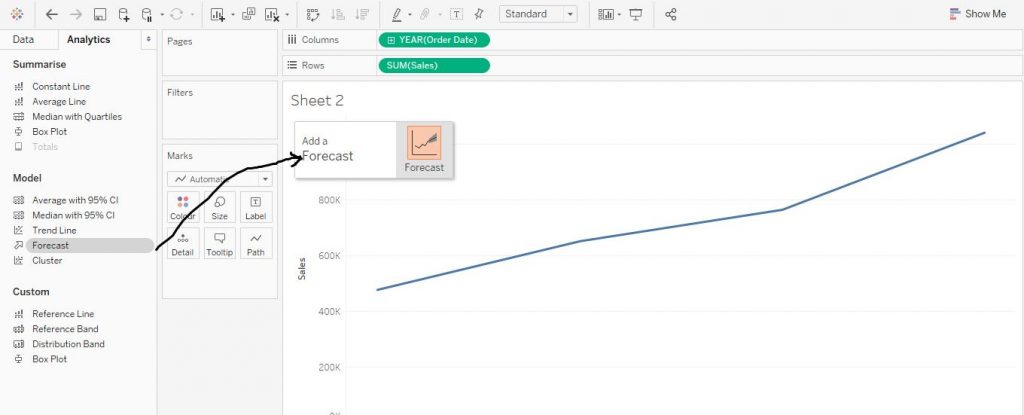
Now click on Forecast under Model section and drag it over to the line chart as shown in the diagram below.
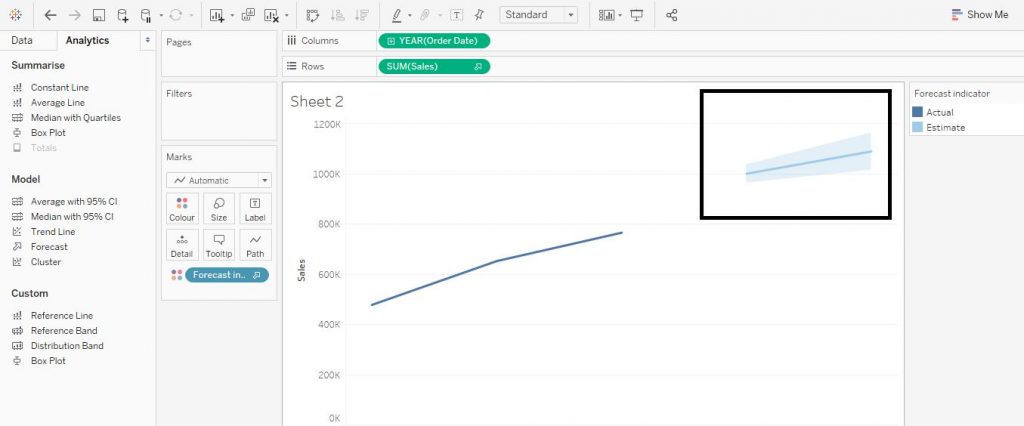
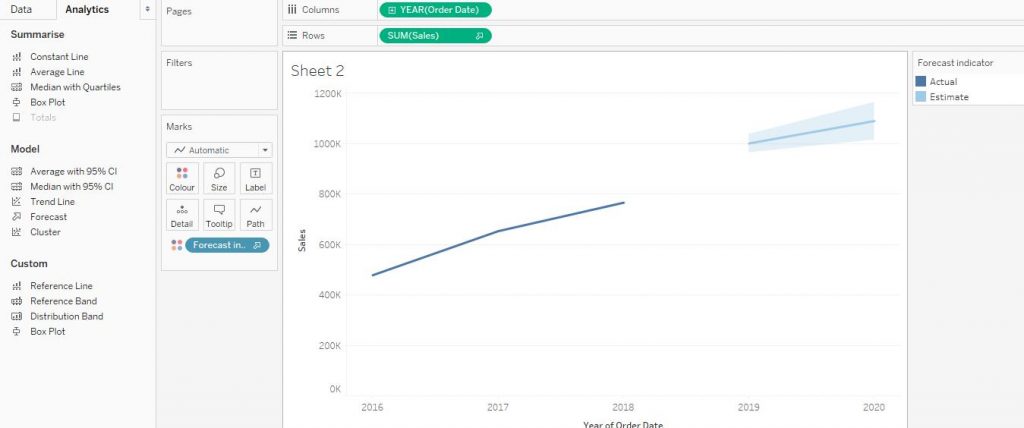
it will show the forecasted line as shown below in the diagram.
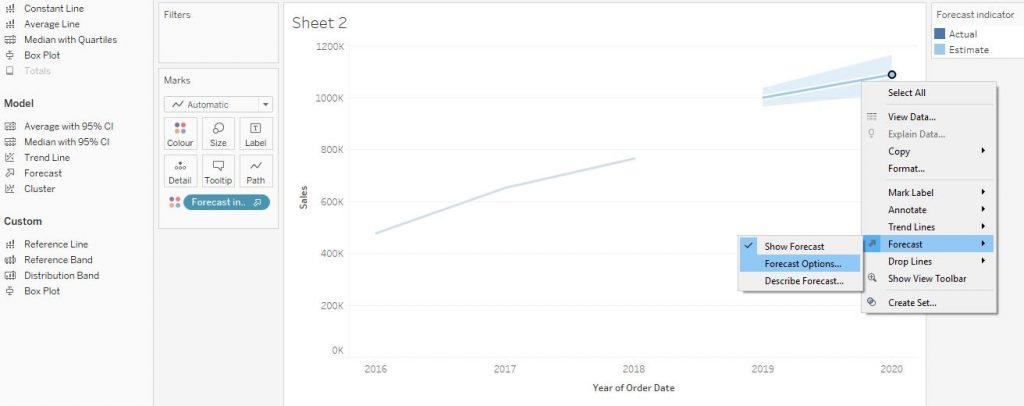
Now right click on the forecasted line, click on Forecast from the drop down menu and again click on Forecast Options as shown by the arrows in the diagram given below.
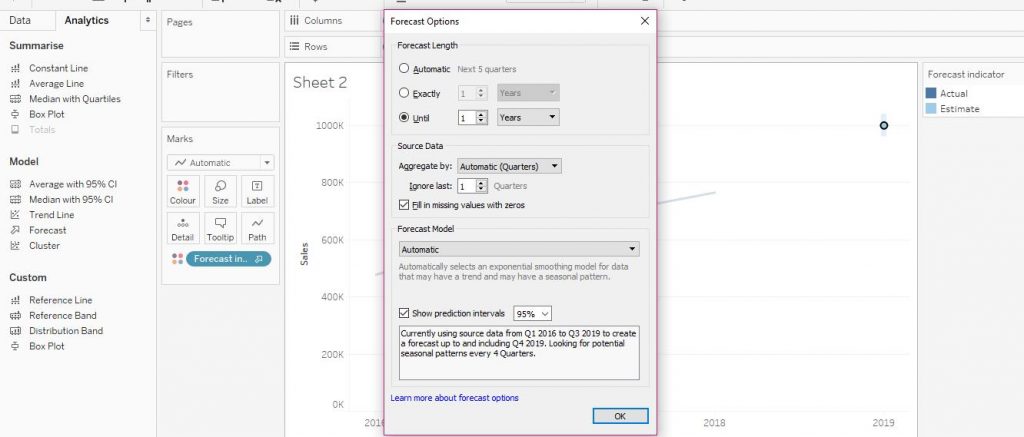
From the new window, click on Until, under the Forecast Length section and increase it to 2 years. Also, tick on the box beside Fill in missing values with zeroes and then click on OK. The arrows in the diagram below explain the step.
The diagram below shows the final forecasted line as per the requirements.
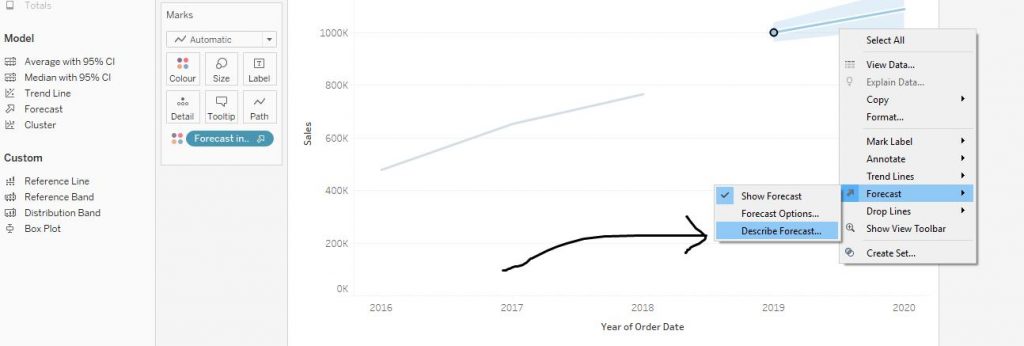
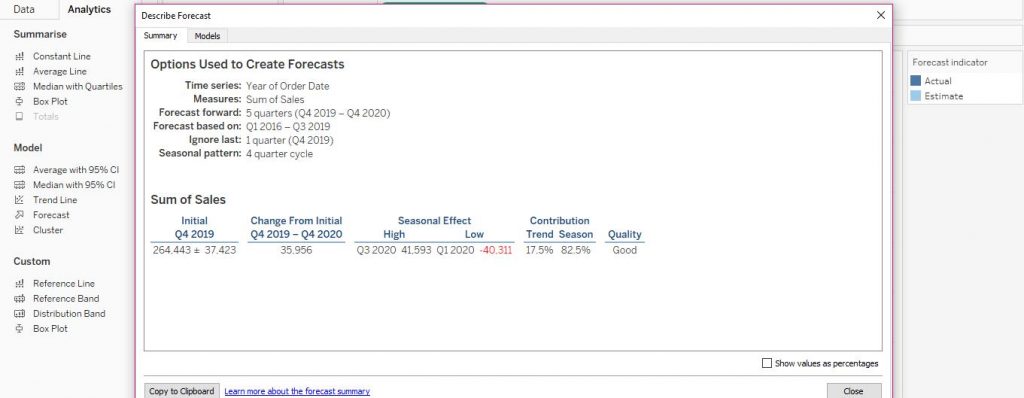
Again, right click on the forecasted line and click on Forecast from the drop down menu and then click on Describe Forecast in order to get all the details of the forecast for better understanding.
The diagram below explains the step.
The window which appears shows the details of the forecast along with the trend and seasonality of the data. The diagram below shows the same.
The Below mentioned Tutorial will help to Understand the detailed information about types of forecasting in tableau.
So just follow all the tutorials of India’s leading Best tableau training institutes in Bangalore and Be a Pro Tableau Developer.

