How to Create Parameters in Tableau (A Simple Guide)
Tableau Installation Tutorial for Beginners, are you looking for the information of tableau server installation steps under tableau course? Or the one who is casually glancing for the best platform which is providing information on how to install tableau software for beginners? Then you’ve landed on the Right Platform which is packed with tons of tutorials of installation of tableau. Follow the below mentioned Tableau Installation tutorial for Beginners which were originally designed by the world-class Trainers of tableau training institute in Bangalore.
Parameters are like containers which stores values like numbers, dates or even strings and can replace them with ease in calculations, filters and visualizations in Tableau. It makes the calculations or visualizations very dynamic with fast replacements as per the requirements. Parameters help to transfer the control of the visualizations from authors to the end users.
Let’s explore the parameters in Tableau. Here, we have used Sample EU Superstore data which is provided by Tableau by default.
Let’s make a parameter where we would be able to change the Dimensions variable and get to see the visualizations respectively without having to run the entire process from the beginning.
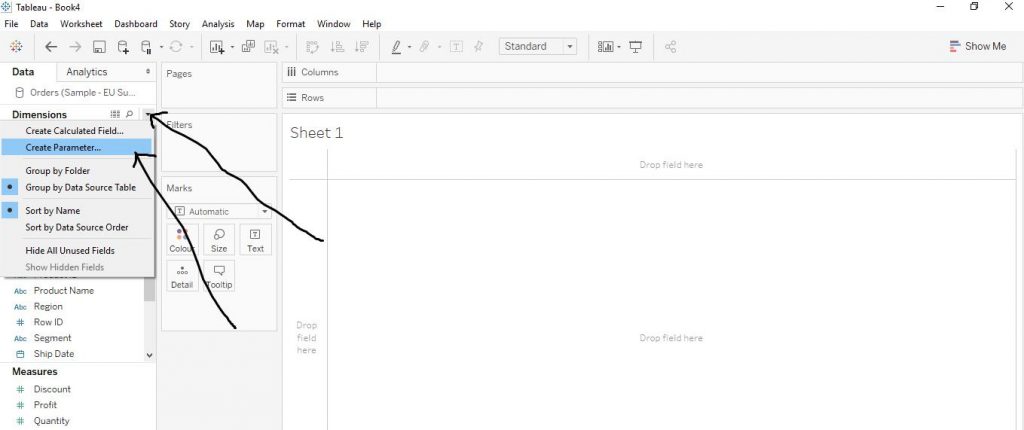
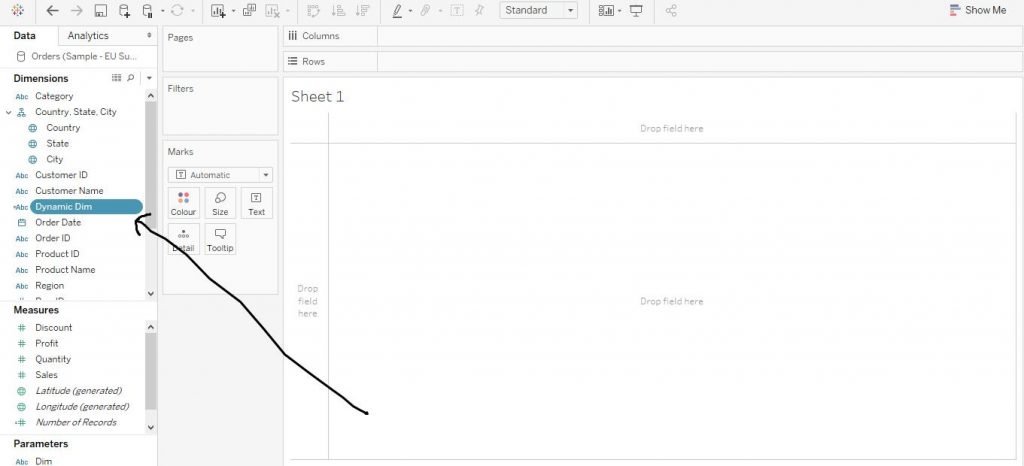
Click on the little arrow beside Dimensions sections and click on Create Parameter from the drop down menu as shown by the arrows in the diagram below.
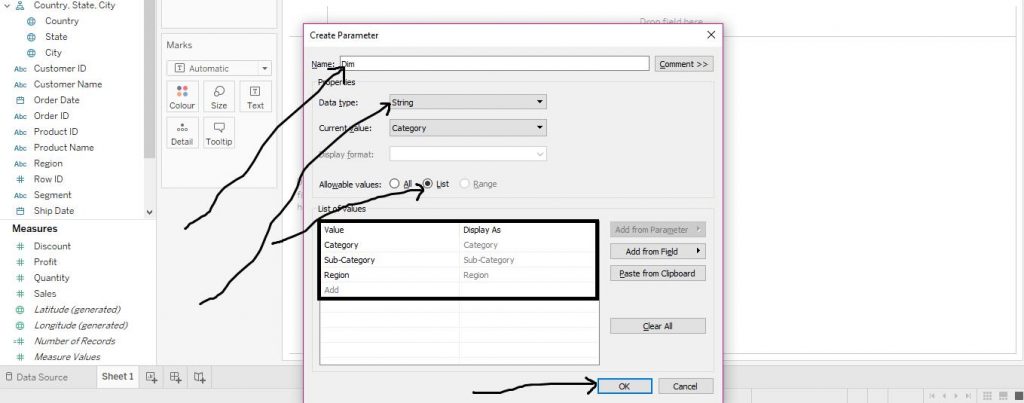
Now put a name of the Parameter. Here, we have named it as ‘Dim’. Change the Data type to ‘String’ as we are going to pass only string values in our parameter. From Allowable values option, select List. Then put the variables’ names as per requirement. Here, we have selected Category, Sub Category and Region. Click on OK. The arrows in the diagram below demonstrate the step.
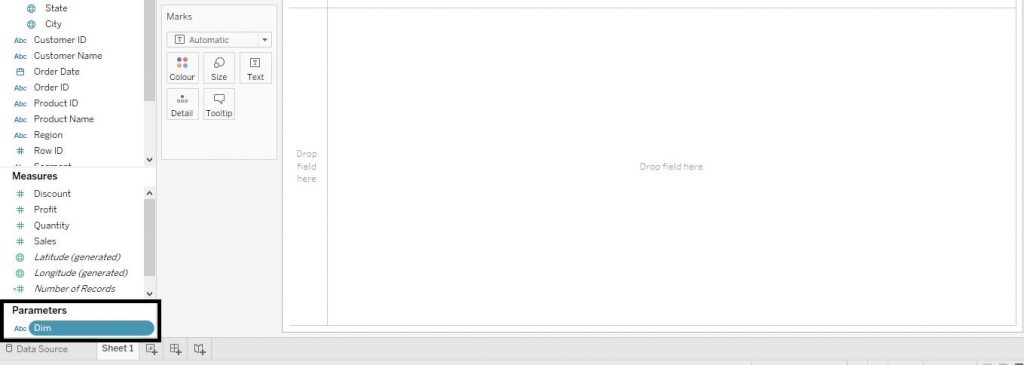
The Parameter ‘Dim’ gets created under the Parameters section as shown in the diagram below.
Now we need a make a Calculated Field in order to make the analyses and visualisations. We have already taught how to make Calculated Field. Refer to the topic once again. We would again quickly teach how we are making the Calculated Field. Click on the little arrow beside Dimensions section and click on Create Calculated Field.
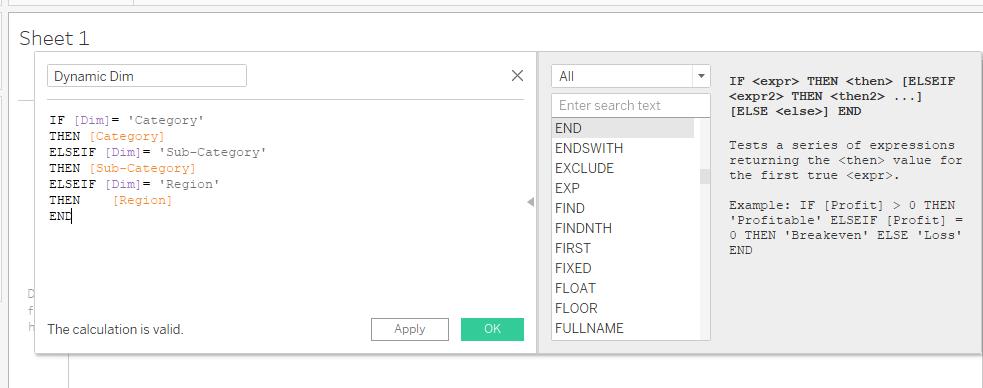
Again, give a name of the Calculated Field. Here, we have used the name as Dynamic Dim. Then write the code as shown below in the diagram and click on Apply and then OK.
The Calculated Field gets created under Dimensions section as shown below in the diagram.
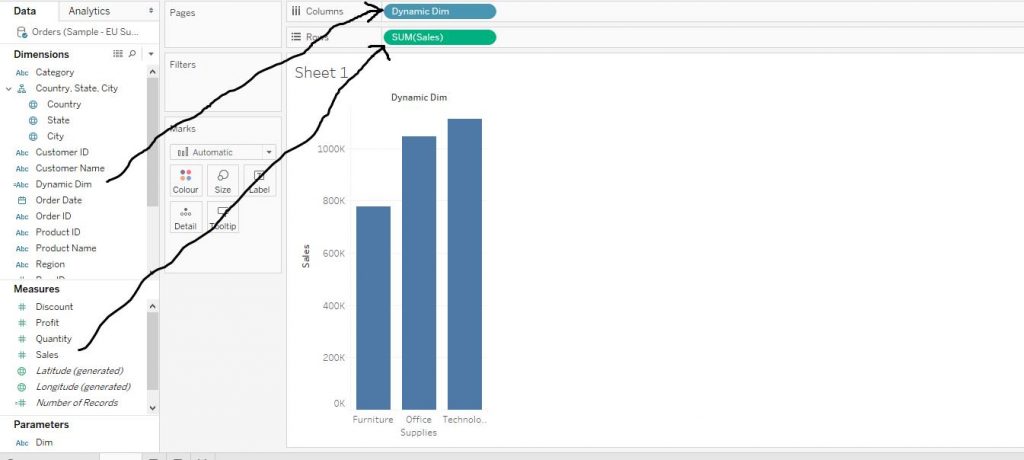
Now drag Calculated Field Dynamic Dim from Dimensions section to Columns shelf and Sales from Measures section to Rows shelf and click on the bars from Show Me section. The arrows in the diagram below show the process.
Now in order to make the dynamic changes in the visualisation with regard to the changing Dimension values, do the following steps.
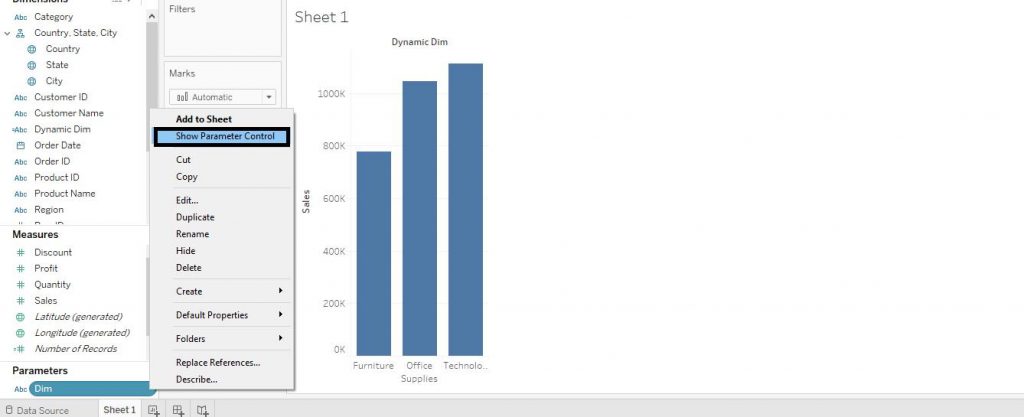
Right click on the parameter Dim and click on Show Parameter Control from the drop down menu. The diagram below demonstrates the step.
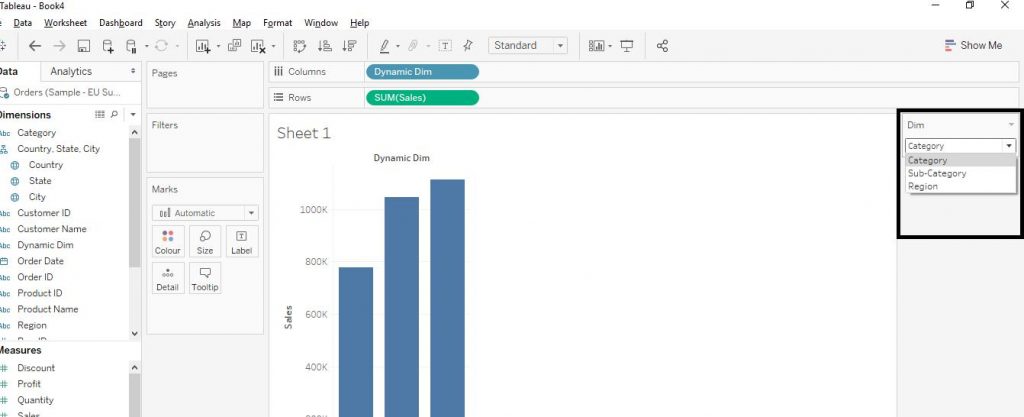
By doing so, the menu is add to the right side of the window where one can change the Dimensions variable as per the requirement and also the visualizations respectively. The diagram below shows the step.
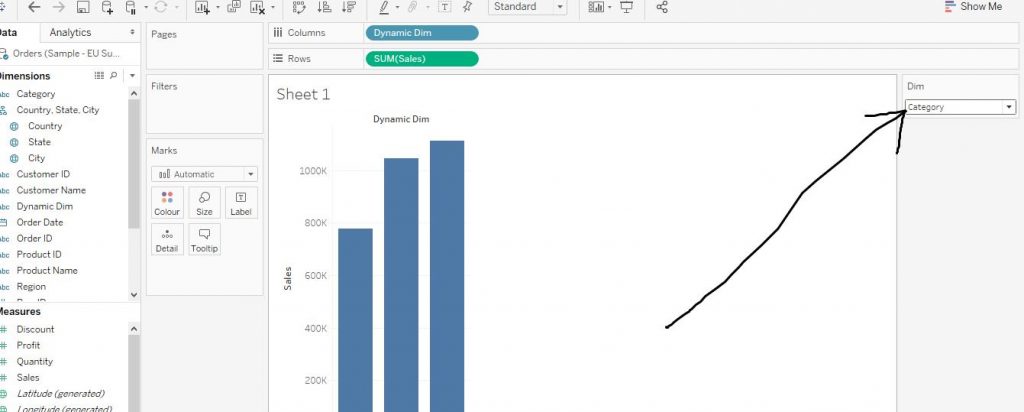
The diagram shows the graph created against Category and Sales.
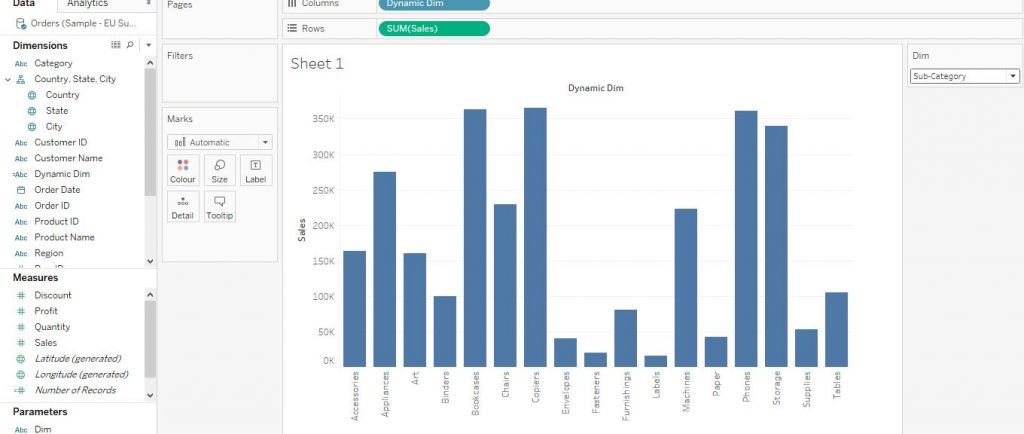
Now we can also change it to any other variable VS Sales just by changing the variable from the Dim menu on the top right. The diagram below demonstrates the step.
Now click on Sub Category from the drop down menu and get the visualization as Sub Category VS Sales as shown below in the diagram.
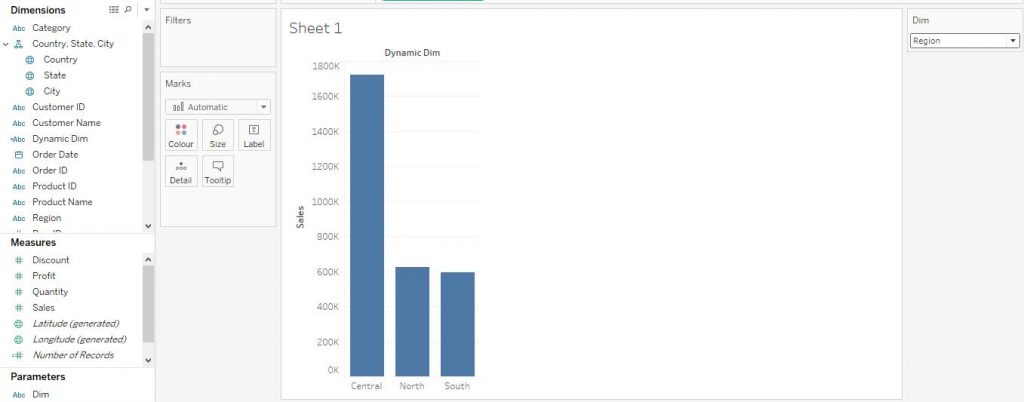
Again, click on Region from the Dim drop down menu to get the graph for Region VS Sales. The diagram below shows the step.
We hope you understand Tableau Installation tutorial for beginners.Get success in your career as a Tableau developer by being a part of the Prwatech, India’s leading Tableau training in Bangalore.

