Word Cloud Chart in Tableau
Word Cloud Chart in Tableau, in this Tutorial one, you can learn about world cloud chart. Are you the one who is looking for the best platform which provides information about how to create word cloud chart? Or the one who is looking forward to taking the advanced Certification Course from India’s Leading Tableau Training Institute? Then you’ve landed on the Right Path.
The Below mentioned Tutorial will help to Understand the detailed information about world cloud chart and How to Make a Word Cloud in Tableau. So just follow all the tutorials of India’s leading Best Tableau Training institute in Bangalore and Be a Pro Tableau Developer.
How to Create Word Cloud Chart
Word clouds are very much similar to bubble charts in which the words are sized with regard to some numerical values and are arranged into a chosen space. They are also known as Tag Cloud. Word clouds are quite a popular kind of info-graphic with the help of which the relative frequency of words in the data can be shown. They are very useful for presenting the data into words. This can be depicte by the colour or the size of the chosen fields in the data. They are a quite strong feature to attract attention to the presentation or story. Though word clouds are not the best chart for accurate interpretation of the data, however, they can sometimes add impact to dashboards and that actually encourages more people to engage with the given dataset.
How to Make a Word Cloud in Tableau
Let’s explore the Cloud Chart in the following steps. We have used the Sample EU Superstore data for our visualisation which is already provided by Tableau by default.
There two approaches for making the Cloud Chart. They are:
By gauging the volume by change of intensity in colours and also by the size of the word.
By gauging the volume from size of the word and different colour codes.
We will start with the first approach.
Drag a variable (we have selected Sub Category here) from Dimensions section to Columns. Again, drag a variable (here we have selected Profit) from Measures section to Rows. Now, click on ‘Tree maps’ from Show Me section. A tree map chart would be create. The figure below demonstrates the procedure.
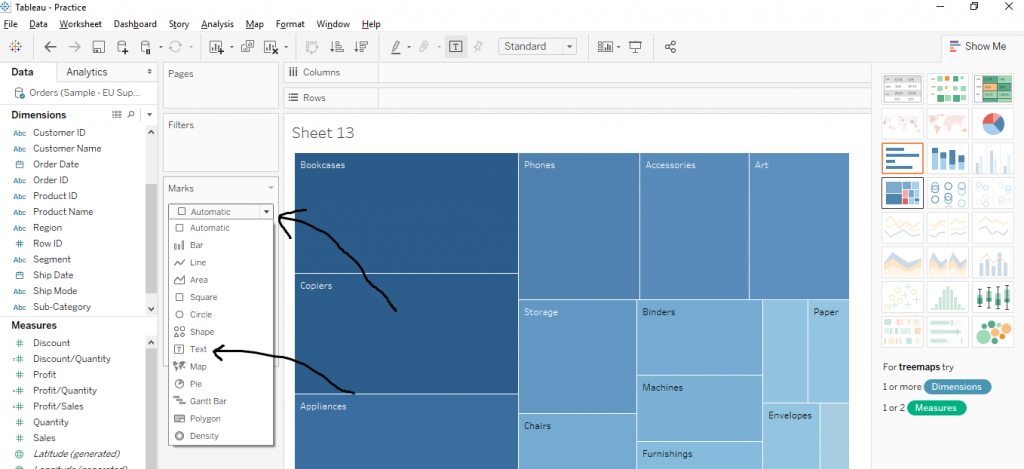
Now go to Marks section and click on the little arrow as shown in the diagram below by arrows and select Text from the drop down menu.

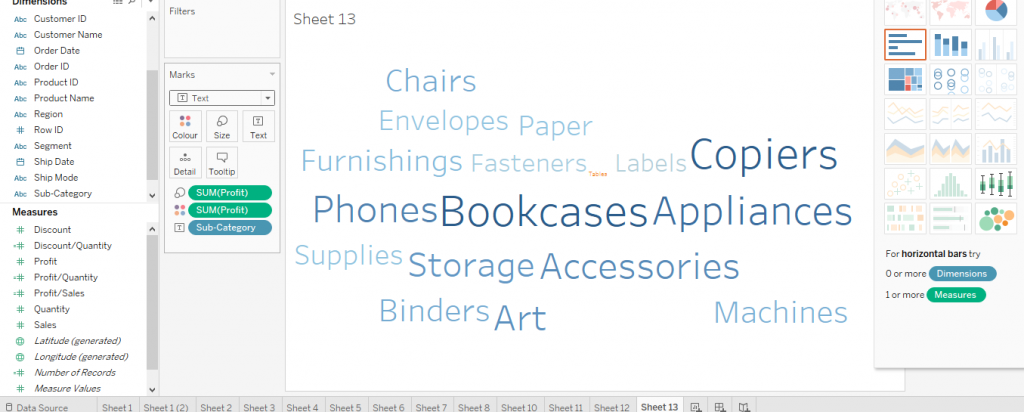
Once you click on Text, the text cloud would be create. The size of the text and intensity of the colour would indicate the volume of profit for that very sub category. The figure below shows the same.
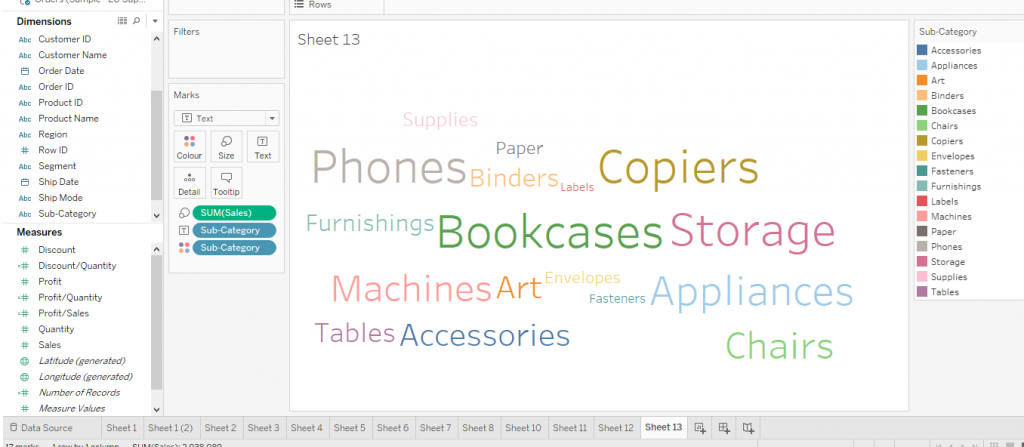
Now, let’s explore the second approach.
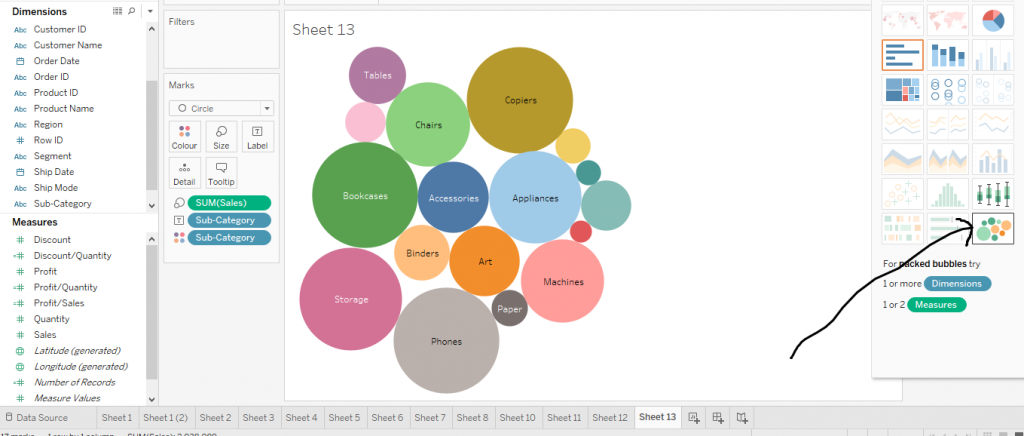
Drag a variable (we have selected Sub Category here) from Dimensions section to Columns. Again, drag a variable (here we have selected Sales) from Measures section to Rows. Now, click on ‘Packed Bubbles’ from Show Me section. A bubbles chart would be create. The arrow in the figure below demonstrates the procedure.
Now go to Marks section and click on the little arrow as shown in the figure below by arrows and select Text from the drop down menu.
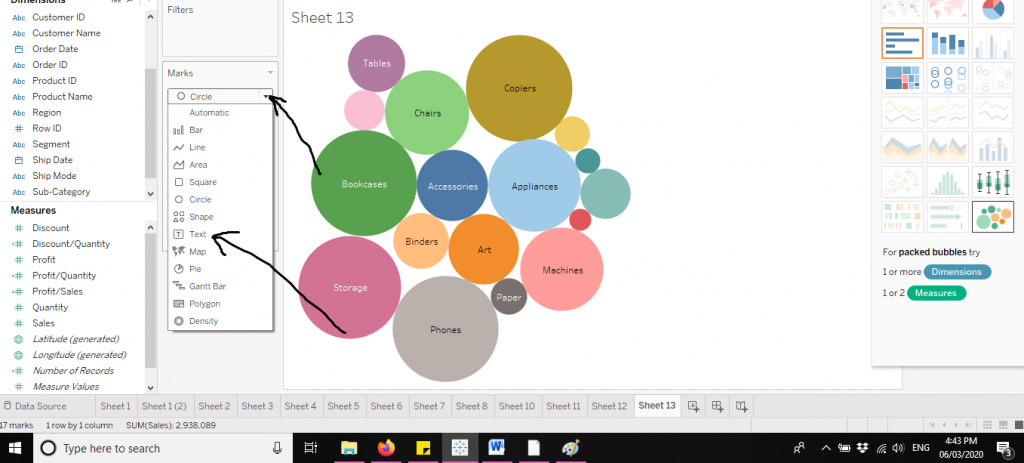
Once you click on Text, the text cloud would be create. The size of the text would indicate the volume of sales for that very sub category and the different colours would indicate different sub categories. The figure below shows the same.
This is the detail information of about How to Make a Word Cloud. I hope you understand our word cloud chart in tableau tutorial and will helpful to you. If you have any queries, mention them in below comment section. If you wish to master in Tableau, Get trained for Tableau Course by Prwatech, India’s largest E-learning Platform.

