A Quick Guide to Annotations in Tableau
Tableau Annotations Tutorial, in this Tutorial one, you can learn about Annotations in tableau. Are you the one who is looking for the best platform which provides information about how to make a Annotations in Tableau? Or the one who is looking forward to taking the advanced Certification Course from India’s Leading
Tableau Training Institute? Then you’ve landed on the Right Path.
The Below mentioned Tutorial will help to Understand the detailed information about Annotations in Tableau. So just follow all the tutorials of India’s leading
Best Tableau Training institute in Bangalore and Be a Pro
Tableau Developer.
Annotations are basically an extra piece of information related to a particular point in a diagram or document. They are comments used as notes or may be even an explanation.
There are three types of annotations in Tableau. They are listed below :
- Mark –It annotates a particular mark, e.g., a circle or a bar.
- Point – It annotates a particular point defined by the coordinates relative to both the axes.
- Area –It annotates a particular area of a graph.
Let’s explore the annotations on Tableau and how to make the charts more informative in nature. Here, we have used Sample EU Superstore data which is provided by Tableau by default.
Firstly make a bar graph by dragging a Dimensions variable (here, we have chosen Sub Category)to Columns shelf and a Measures variable (here, we have used Sales) to Rows shelf and then clicking on bars from the Show Me section. We have already taught
how to make bar graphs. For more details, refer to the chapter.
Let’s explore each of the types of Annotations.
Mark Annotations
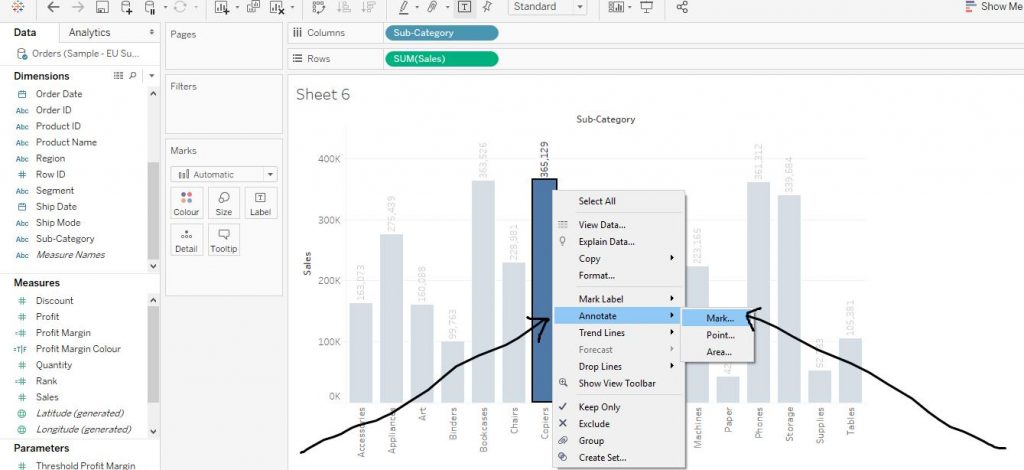
Right click on any bar. Then click on Annotate and again click on Mark as shown by the arrows in the diagram below.
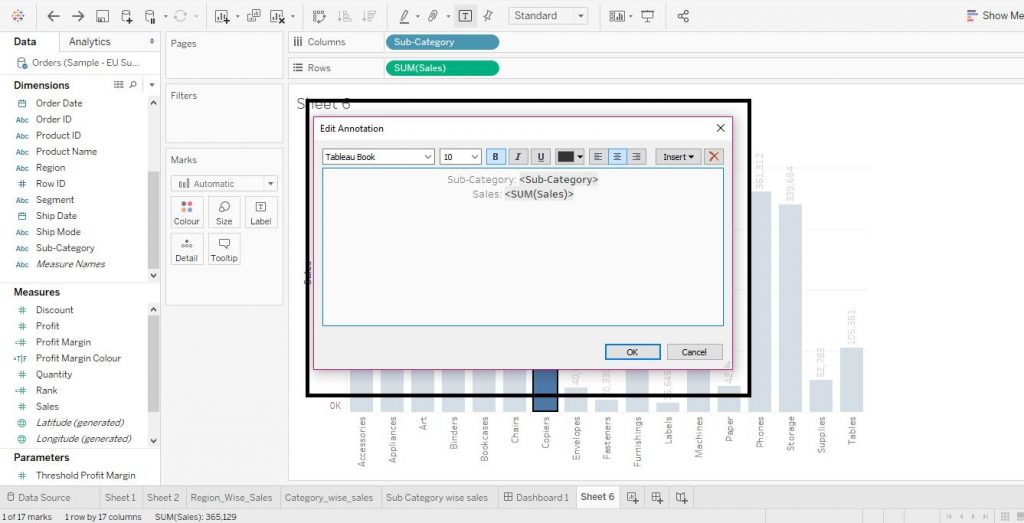
Then a drop box appears. You can write any comment on it (here, we have written “This sub category has highest amount of Sales”) and click on OK as shown in the diagram below.
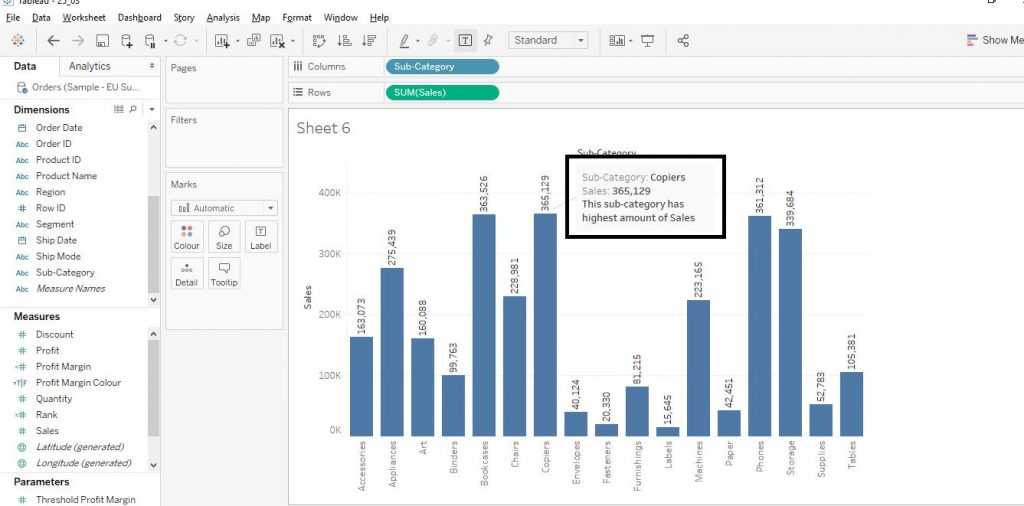
The diagram below shows the creation of Mark Annotation.
Now let’s move on to the next type of Annotations.
Point Annotations
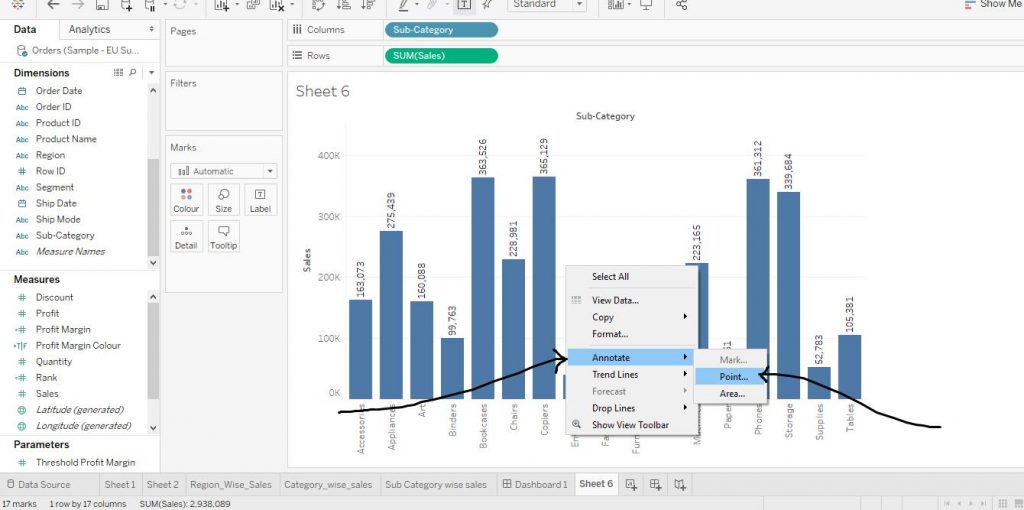
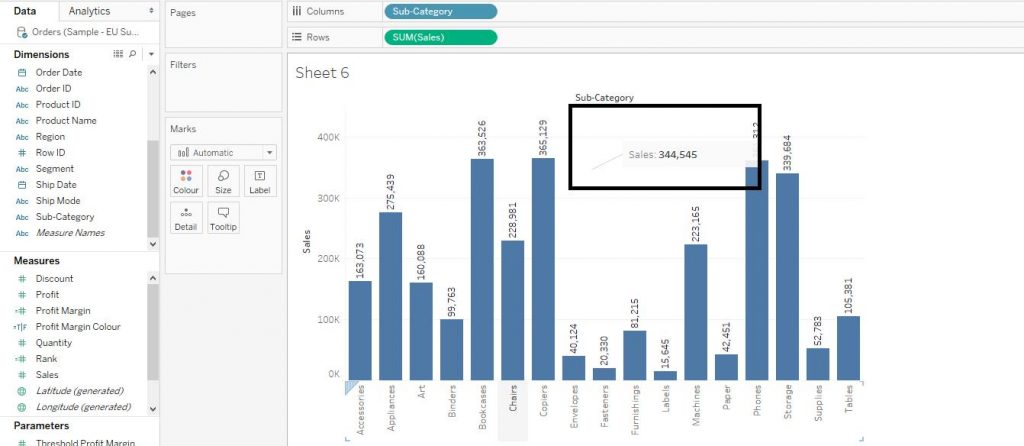
Right click on any point on the chart and click on Annotate and click on Point. The arrows below demonstrate the step.
And then add any comment in the dialog box and click on OK. The diagram below shows the point annotation according to its coordinates.
Let’s move on to the third type of annotations.
Area Annotation
Again, right click on the chart and click on Annotate. Click on Area. The arrows in the diagram below explain the step.
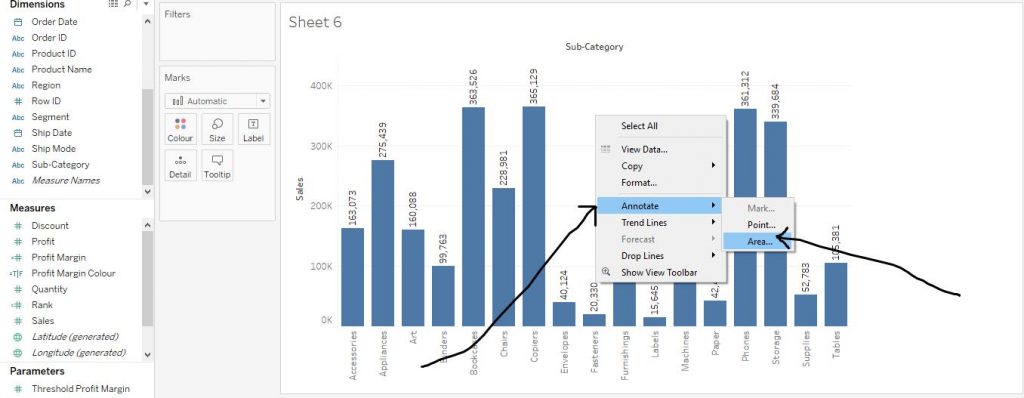
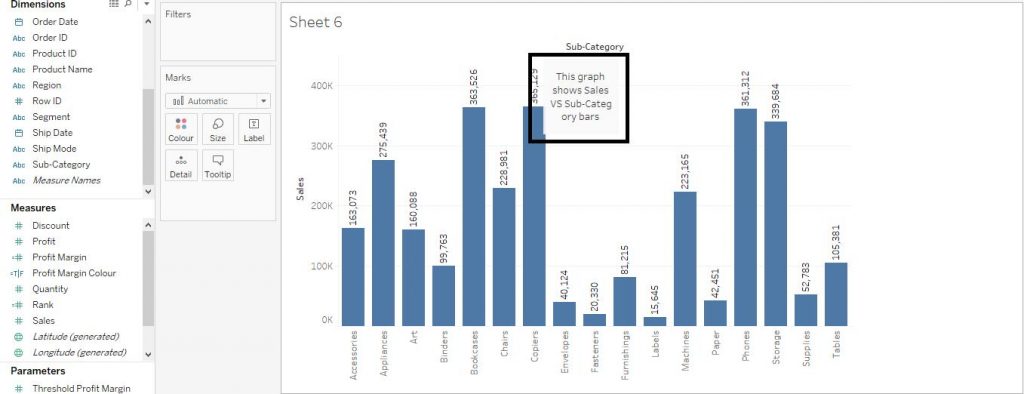
Then in the dialog box, add a comment (here, we have written “This graph shows Sales VS Sub Category bars”)as per requirement and then click on Apply and then click on OK. The Area Annotation is depicted in the diagram below.
Let’s learn how to format the Annotations.
Right click on the Annotation on the chart. Click on Format. The diagram below shows the step.
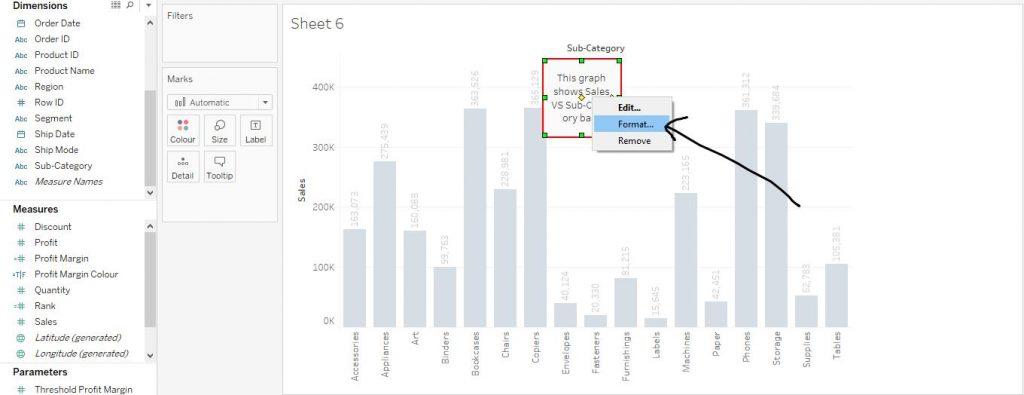
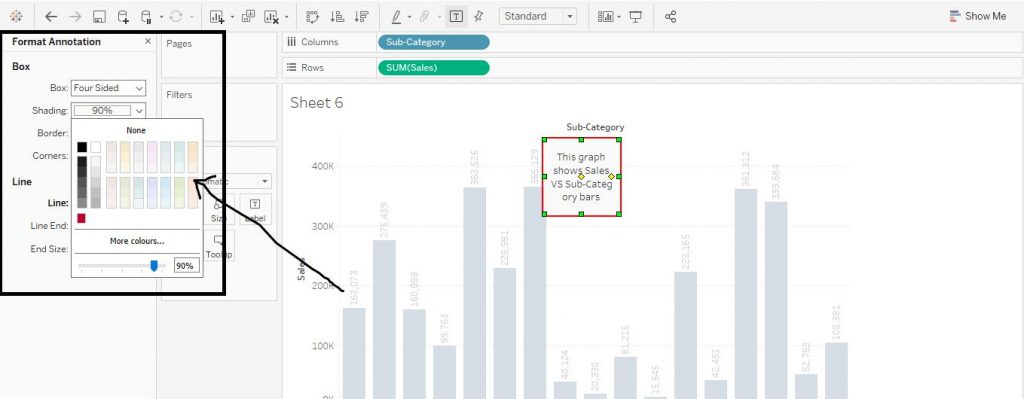
Now choose the formatting options like shading, border, line etc. The diagram below explains the step.
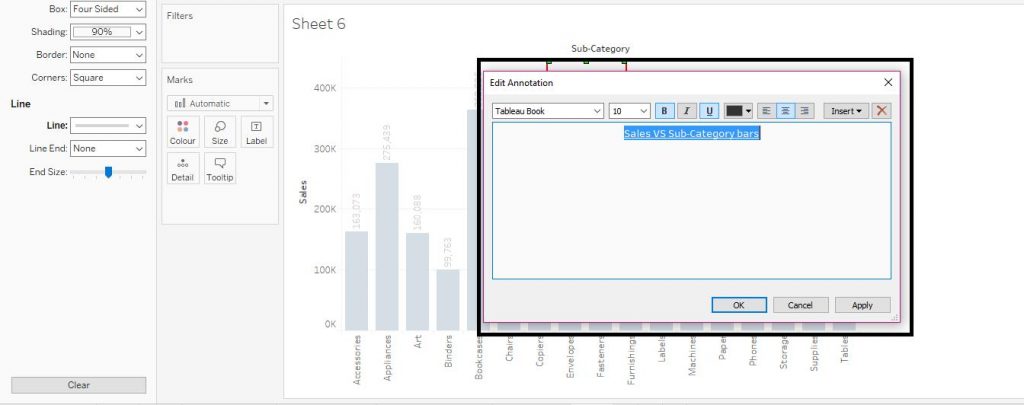
Let’s check how to edit the Annotation. Right click on the Annotation and click on Edit. In the dialog box, you can change the comment and even make some format changes. The diagram below shows the same.
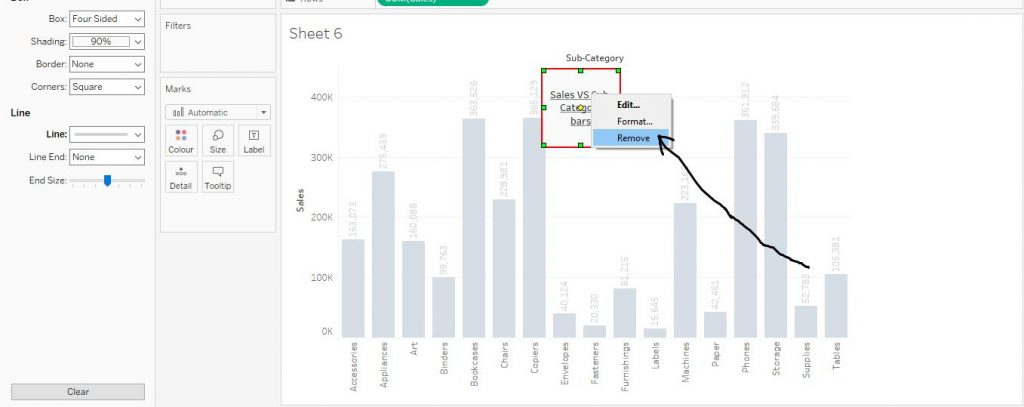
In order to remove the Annotation, right click on it. Click on Remove. The diagram below explains the step.
Annotations are basically an extra piece of information related to a particular point in a diagram or document.
This is the detail information of about how to make a Annotations in tableau. I hope you understand our Tableau Annotations tutorial and will helpful to you. If you have any queries, mention them in below comment section. If you wish to master in Tableau, Get trained for
Tableau course by
Prwatech, India’s largest E-learning Platform.
 Then a drop box appears. You can write any comment on it (here, we have written “This sub category has highest amount of Sales”) and click on OK as shown in the diagram below.
 The diagram below shows the creation of Mark Annotation.
 Now let’s move on to the next type of Annotations.
Point Annotations
Right click on any point on the chart and click on Annotate and click on Point. The arrows below demonstrate the step.
 And then add any comment in the dialog box and click on OK. The diagram below shows the point annotation according to its coordinates.
 Let’s move on to the third type of annotations.
 Then in the dialog box, add a comment (here, we have written “This graph shows Sales VS Sub Category bars”)as per requirement and then click on Apply and then click on OK. The Area Annotation is depicted in the diagram below.
 Let’s learn how to format the Annotations.
Right click on the Annotation on the chart. Click on Format. The diagram below shows the step.
 Now choose the formatting options like shading, border, line etc. The diagram below explains the step.
 Let’s check how to edit the Annotation. Right click on the Annotation and click on Edit. In the dialog box, you can change the comment and even make some format changes. The diagram below shows the same.
 In order to remove the Annotation, right click on it. Click on Remove. The diagram below explains the step.
 Annotations are basically an extra piece of information related to a particular point in a diagram or document.
This is the detail information of about how to make a Annotations in tableau. I hope you understand our Tableau Annotations tutorial and will helpful to you. If you have any queries, mention them in below comment section. If you wish to master in Tableau, Get trained for Tableau course by Prwatech, India’s largest E-learning Platform.


