Tableau Text Table Tutorial
Tableau Text Table Tutorial, in this Tutorial one, you can learn about tableau text table. Are you the one who is looking for the best platform which provides information about how to create text table in tableau? Or the one who is looking forward to taking the advanced Certification Course from India’s Leading Tableau Training Institute? Then you’ve landed on the Right Path.
The Below mentioned Tutorial will help to Understand the detailed information about tableau text table. So just follow all the tutorials of India’s leading Best Tableau Training institute in Bangalore and Be a Pro Tableau Developer.
Tableau Text Table
Let’s explore the Text Tables Chart that can be created on Tableau. Here we are using Sample – EU Superstore data which is provided by Tableau by default. Text Tables is also known as pivot tables or cross tabs is extensively used in any analysis. Its characteristic features are as follows: Simple – Text Tables Chart very simply represents the data in a tubular form which can further be customised (which is discussed below). Comprehension - Text Tables Chart is very easy to comprehend. One can draw insights of the data just by looking at the chart. Precision – Text Tables Chart precisely represents the data pictorially. Even a lay man who does not have much of prior knowledge with regard to analytics can understand the data and draw meaningful insights from it. It very well comes in handy while taking business decisions.How to Create Text Table in Tableau?
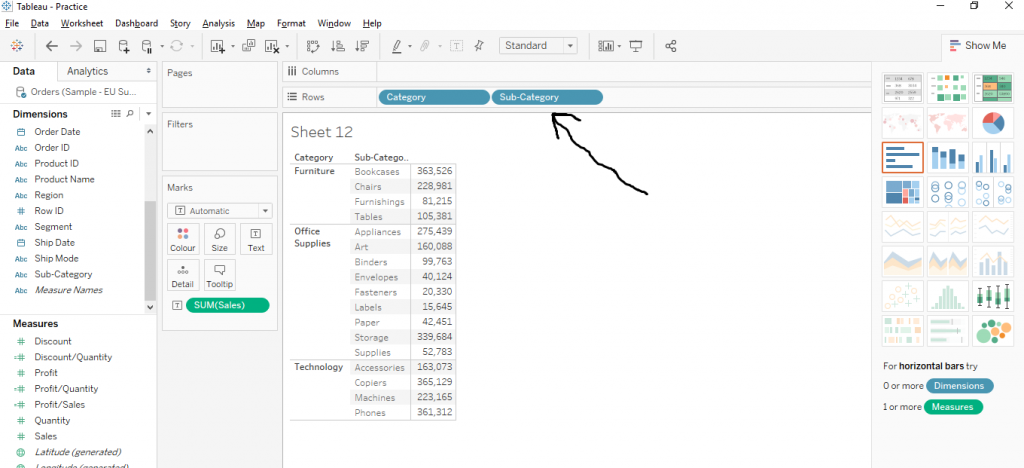
Select a variable from Dimensions section (here we have selected ‘Category’ variable’) and another variable from Measures section (we have selected ‘Sales’ here) simultaneously and then from ‘Show Me’ section, select ‘Text Tables’ chart. The arrows in the diagram below describe the same.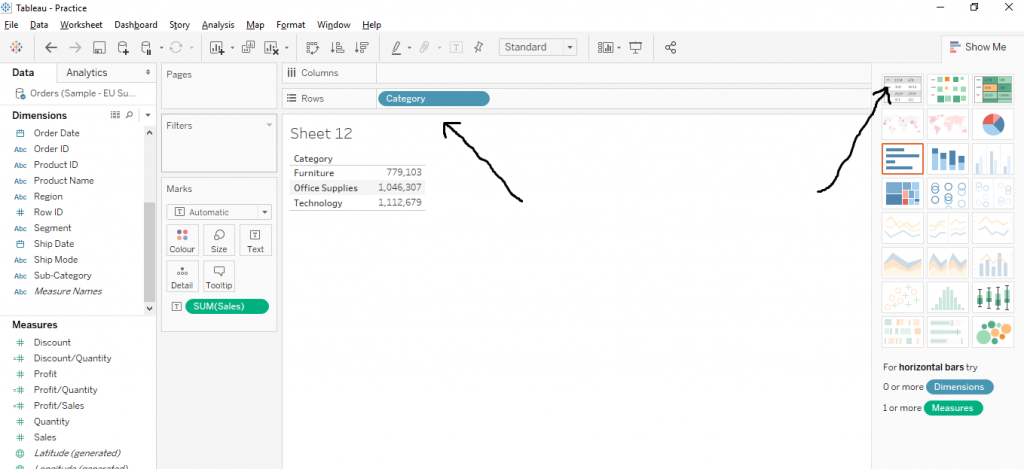 Now drag another variable from Dimensions section to the Rows as shown by the arrow. The chart now shows the sum of sales across categories and further split by the sub categories.
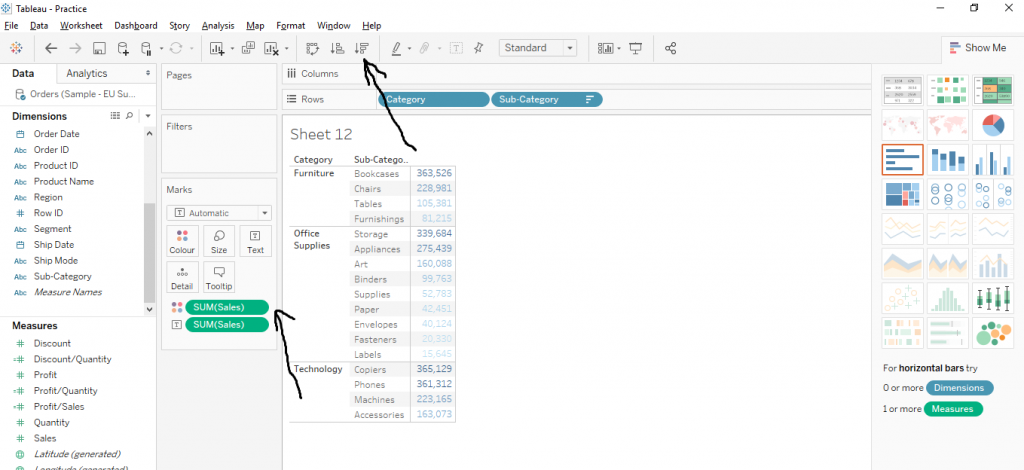
 Now we can re-arrange the chart in descending order with regard to Sales as per Categories and further by Sub Categories. Drag the Sales variable to the ‘Colour’ in the Marks section for better visualisations. The arrows in the picture below explain this.
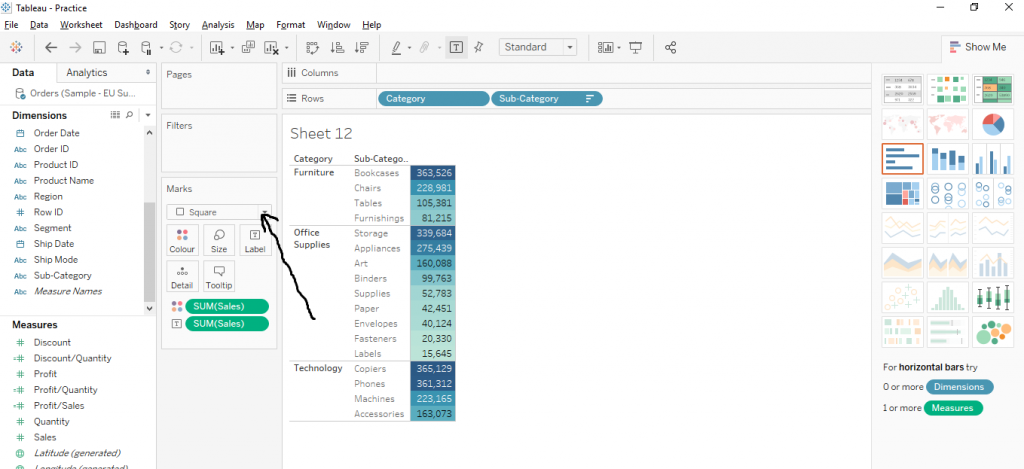
Again, click on the Square from Marks section to add colours in the background. The arrow in the given figure explains this.
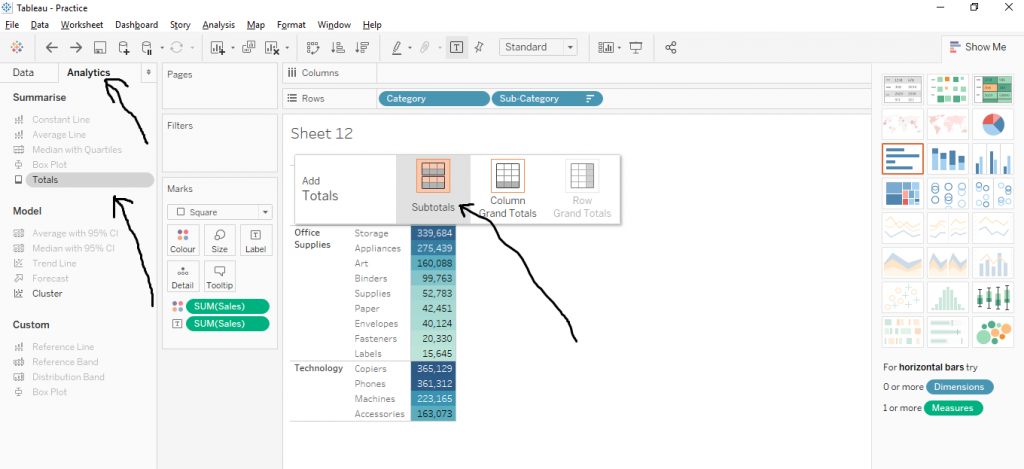
 Now let’s add some more analytical features to the chart. Go to the ‘Analytics’ tab as shown by the arrow. From there click on Totals from ‘Summarise’ section. Now drag the Totals to the sheet and from the ‘Add Totals’ window, select Subtotals. The arrows would describe the same.
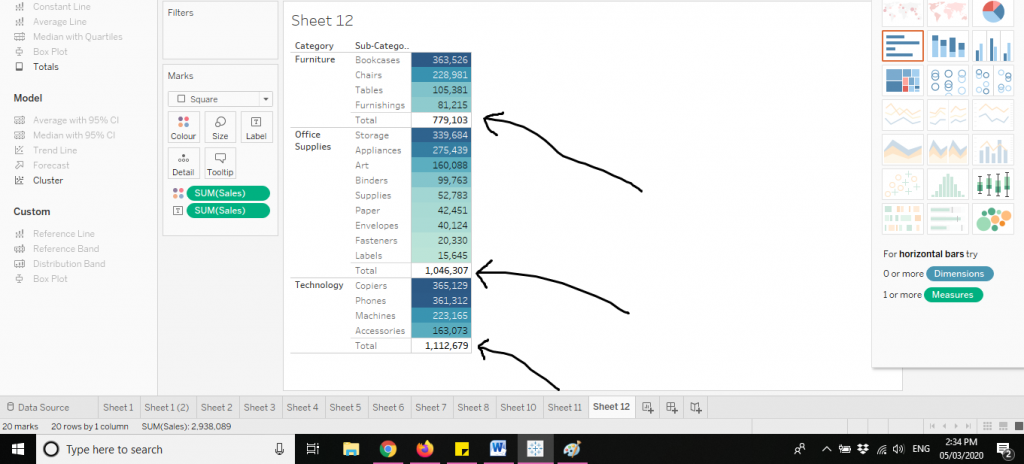
 The sub totals as per categories appear in the chart. The same is shown by the arrows in the diagram below.
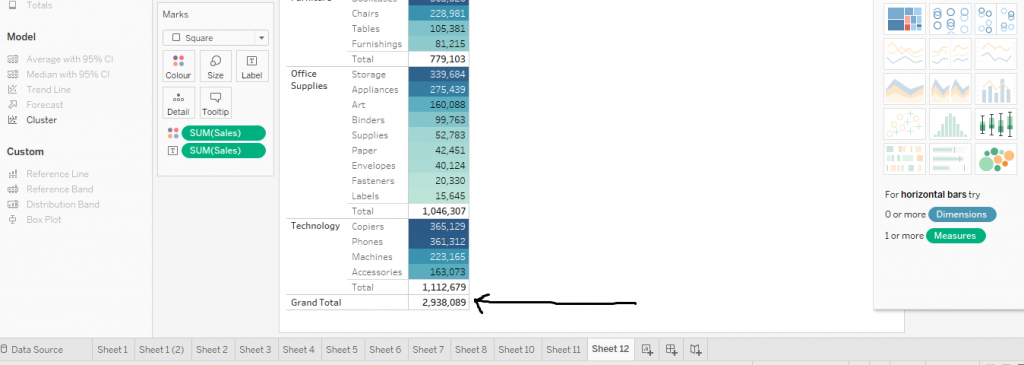
 Now in order to show the grand total, again drag Totals from Analytics section to the ‘Column Grand Totals’ as shown by the arrow in the figure. Now the Grand Total is also shown in the chart. The arrow in the diagram given below points out the Grand Total.
 This is the detail information of about how to create text table in tableau. I hope you understand our Tableau Text Table tutorial and will helpful to you. If you have any queries, mention them in below comment section. If you wish to master in Tableau, Get trained for Tableau course by Prwatech, India's largest E-learning Platform.

