Statistics Interview Questions
Statistics Questions For Interviews and Answers
statistics questions for interviews and answers, are you looking for the best interview questions on statistics? Or hunting for the best platform which provides a list of Top Rated statistics interview questions for data scientist for experienced? Then stop hunting and follow Best Data science Training Institute for the List of Top-Rated statistics interview questions for data analyst questions and answers for experienced for which are useful for both Fresher’s and experienced.
Are you the one who is a hunger to become Pro certified Data science Developer then ask your Industry Certified Experienced Data Science Trainer for more detailed information? Don’t just dream to become Pro-Developer Achieve it learning the Data Science Course under world-class Trainer like a pro. Follow the below-mentioned interview questions on statistics with answers to crack any type of interview that you face.
What is inferential statistics?
Ans:-It generates larger data and applies probability theory to draw a conclusion
What is the mean value of statistics?
Ans)Mean is the average value of the data set.
What is Mode value in statistics?
Ans)The Most repeated value in the data set
What is the median value in statistics?
Ans)The middle value from the data set
What is the Variance in statistics?
Ans)Variance measures how far each number in the set is from the mean.
What is Standard Deviation in statistics?
Ans)It is a square root of the variance
How many types of variables are there in statistics?
Ans)They are as follows:
1.Categorical variable
2.Confounding variable
3.Continuous variable
4.Control variable
5.Dependent variable
6.Discrete variable
7.Independent variable
8.Nominal variable
9.Ordinal variable
10.Qualitative variable
11.Quantitative variable
12.Random variables
13.Ratio variables
14.Ranked variables
How many types of distributions are there?
Ans)They are the following:
1.Bernoulli Distribution
2.Uniform Distribution
3.Binomial Distribution
4.Normal Distribution
5.Poisson Distribution
6.Exponential Distribution
What is the normal distribution?
Ans) It’s like a bell curve distribution. Mean, Mode and Medium are equal in this distribution. Most of the distributions in statistics are a normal distribution.
What is the standard normal distribution?
Ans)If mean is 0 and the standard deviation is 1 then we call that distribution as the standard normal distribution.
What is Binominal Distribution?
Ans)A distribution where only two outcomes are possible, such as success or failure and where the probability of success and failure is the same for all the trials then it is called a Binomial Distribution
What is the Bernoulli distribution?
Ans)A Bernoulli distribution has only two possible outcomes, namely 1 (success) and 0 (failure), and a single trial.
What is the Poisson distribution?
Ans)A distribution is called Poisson distribution when the following assumptions are true:
1. Any successful event should not influence the outcome of another successful event.
2. The probability of success over a short interval must equal the probability of success over a longer interval.
3. The probability of success in an interval approaches zero as the interval becomes smaller.
What is the central limit theorem?
Ans)They are as follows:
1. The mean of the sample means is close to the mean of the population
2. The standard deviation of the sample distribution can be found out from the population standard deviation divided by the square root of sample size N and it is also known as the standard error of means.
3. if the population is not a normal distribution, but the sample size is greater than 30 the sampling distribution of sample means approximates a normal distribution
What is P-Value, How it’s useful?
1. The p-value is the level of marginal significance within a statistical hypothesis test representing the probability of the occurrence of a given event.
2. If the p-value is less than 0.05 (p<=0.05), It indicates strong evidence against the null hypothesis, you can reject the Null Hypothesis
3. If the P-value is higher than 0.05 (p>0.05), It indicates weak evidence against the null hypothesis, you can fail to reject the null Hypothesis
What is Z value or Z score (Standard Score), How it’s useful?
Ans)Z score indicates how many standard deviations on the element is from the mean. It is also called the standard score.
1.Z score Formula
z = (X – μ) / σ
2. It is useful in Statistical testing.
3. Z-value is range from -3 to 3.
4. It is useful to find the outliers in large data
What is T-Score, What is the use of it?
1. It is a ratio between the difference between the two groups and the difference within the groups. The larger t score, the more difference there is between groups. The smaller t-score means the more similarity between groups.
2. We can use t-score when the sample size is less than 30, It is used in statistical testing
What is IQR ( Interquartile Range ) and Usage?
Ans)
1. It is the difference between 75th and 25th percentiles, or between upper and lower quartiles,
2. It is also called Misspread data or Middle 50%.
3. Mainly to find outliers in data, if the observations that fall below Q1 − 1.5 IQR or above Q3 + 1.5 IQR those are considered as outliers.
4.Formula IQR = Q3-Q1
What is Hypothesis Testing?
Ans)
Hypothesis testing is a statistical method that is used in making statistical decisions using experimental data. Hypothesis Testing is basically an assumption that we make about the population parameter.
How many Types of Hypothesis Testing are there?
1.Null Hypothesis, Alternative Hypothesis
What is a Type 1 Error?
FP – False Positive ( In statistics it is the rejection of a true null hypothesis)
What is a Type 2 Error?
Ans) FN – False Negative ( In statistics it is failing to reject a false null hypothesis)
Best Data science Training institute
What is Univariate, Bivariate, Multi-Variate Analysis ?
Ans) They are as follows:
1. Univarite means single variable – Analysis on single variable data
2. Bivariate means two variables – you can do analysis on multiple variables
3. Multi-Variate means multiple variables – Analysis of multiple variables
Explain the difference between Type I error & Type II error
Ans:- Type I and type II errors are part of the process of hypothesis testing.
1. Type I errors happen when we reject a true null hypothesis.
2. Type II errors happen when we fail to reject a false null hypothesis.
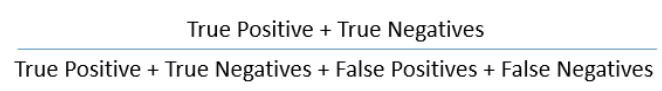
What is Accuracy?
Ans. Accuracy is a metric by which one can examine how good is the machine learning model. Let us look at the confusion matrix to understand it in a better way:
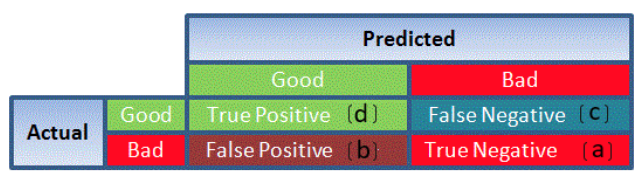
So, the accuracy is the ratio of correctly predicted classes to the total classes predicted. Here, the accuracy will be:
What is Z-test
Ans Z-test determines to what extent a data point is away from the mean of the data set, in standard deviation. For example:
Principal at a certain school claims that the students in his school are above average intelligence. A random sample of thirty students has a mean IQ score of 112. The mean population IQ is 100 with a standard deviation of 15. Is there sufficient evidence to support the principal’s claim?
So we can make use of a z-test to test the claims made by the principal. Steps to perform z-test:
1. Stating the null hypothesis and alternative hypothesis.
2. State the alpha level. If you don’t have an alpha level, use 5% (0.05).
3. Find the rejection region area (given by your alpha level above) from the z-table. An area of .05 is equal to a z-score of 1.645.
4. Find the test statistics using this formula:
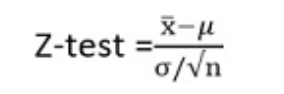
Here,
1. x ̅is the sample mean
2. σ is population standard deviation
3. n is sample size
4. μ is the population mean
If the test statistic is greater than the z-score of the rejection area, reject the null hypothesis. If it’s less than that z-score, you cannot reject the null hypothesis.


