Loading Datasets in Power BI Desktop
Loading Datasets in Power BI Desktop
Before you can build any report or chart in Power BI, you need data loaded into Power BI Desktop first. This is done through the Get Data button, which connects to a data source, whether that is a file on your computer, a database, an online service, or an existing dataset your organization has already published, and brings it into your report.
Common Data Sources You Can Connect To
Get Data is not limited to Excel. It groups data sources into a few broad categories:
- Files, such as Excel workbooks, CSV or text files, JSON, XML, and PDF. This is the most common starting point, especially for individual analysts working from files on their own computer.
- Databases, such as SQL Server or Azure SQL Database, where you connect directly to a live database rather than a file.
- Online services, such as Salesforce, Google Analytics, or SharePoint, for data that already lives in a cloud based platform.
- Power BI datasets, also called semantic models, which are datasets someone in your organization has already built and published to the Power BI service. Connecting to one of these lets you build a new report on top of existing, already modeled data instead of starting from a raw file.
Import Versus DirectQuery
When you connect to most data sources, Power BI asks you to choose a connectivity mode. Import copies the data into your Power BI file itself, which makes the report fast to work with but means the data only updates when you manually refresh it. DirectQuery leaves the data where it is and queries it live each time a report loads, which keeps everything current but depends on the speed of the original source. For a first dataset while you are still learning, Import is the simpler and faster choice, and it is what the steps below use.
Step by Step Process of Loading Datasets in Power BI Desktop
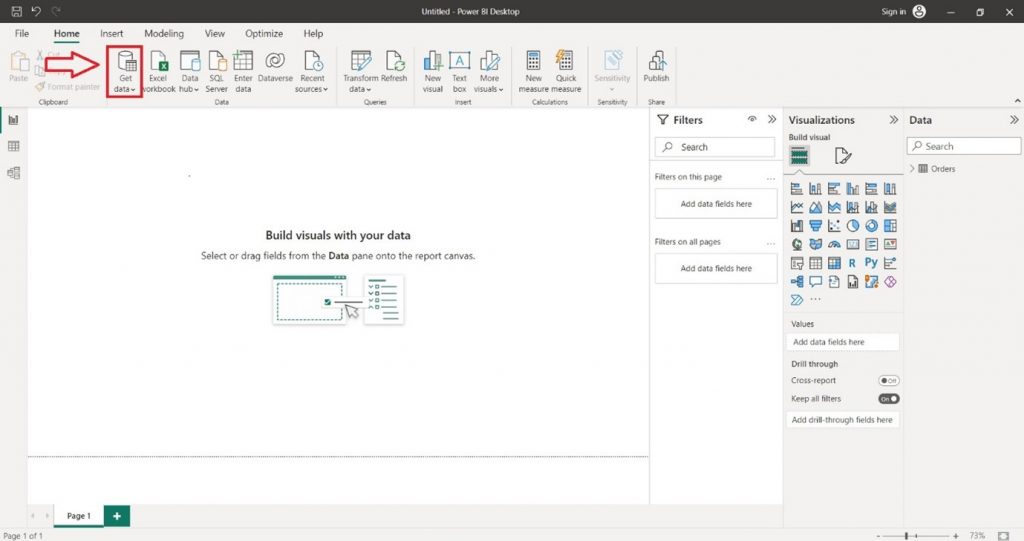
Step 1: Open Get Data
On the Home tab of Power BI Desktop, click the Get Data button. This opens a dropdown menu listing the available data source options.
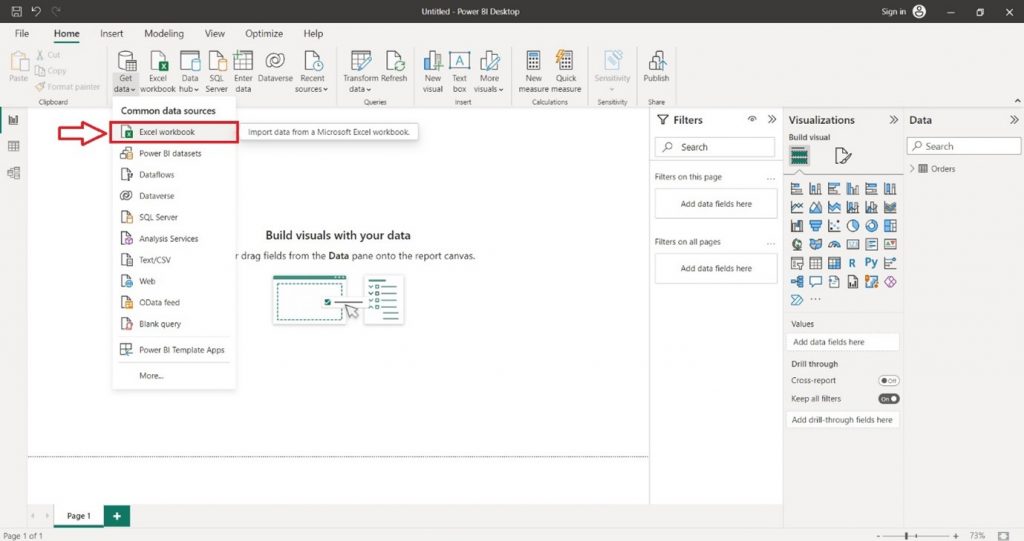
Step 2: Choose Your Data Source
Select the source that matches where your data is stored. In this example, we are choosing Excel workbook, one of the most common starting points.
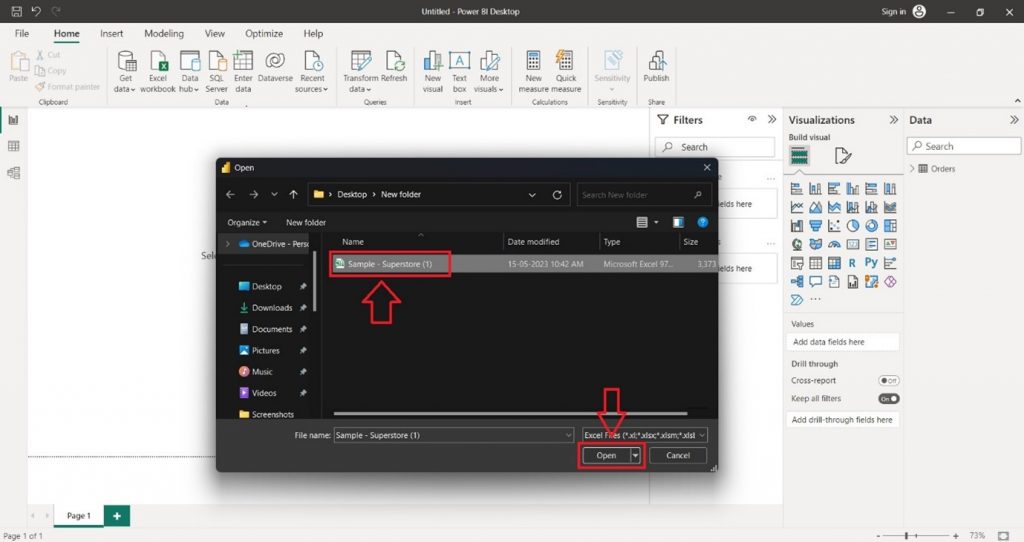
Step 3: Locate and Open Your File
A File Explorer window will appear. Find your dataset file and click Open.
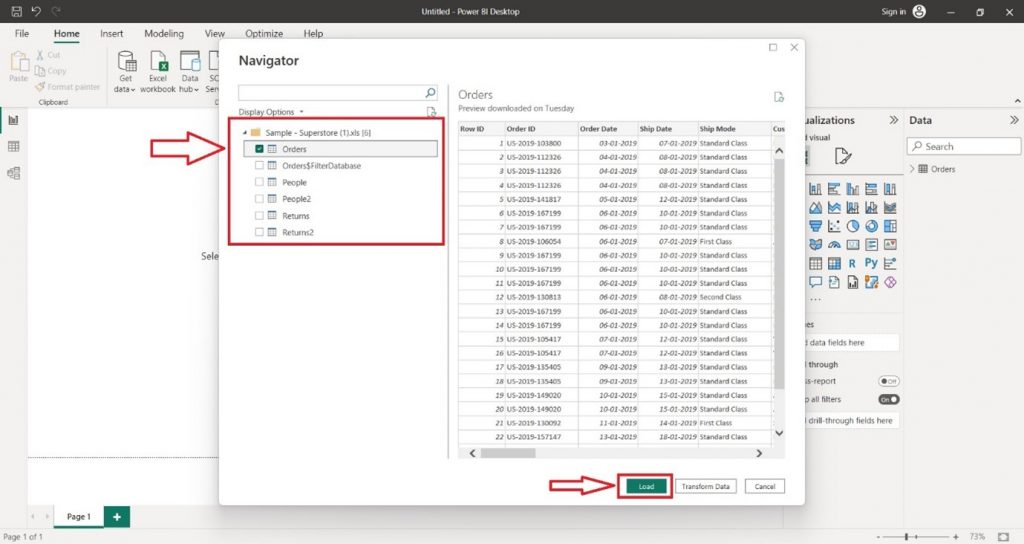
Step 4: Load the Data
A preview window called the Navigator will appear, showing the tables available in your file. Select the ones you want, then click Load.
Common Mistakes to Avoid
- Loading every table without checking the Navigator preview first. Take a moment to confirm you are loading the right tables and that the data looks correct before clicking Load, since fixing it afterward means reloading.
- Choosing Import for data that changes constantly and needs to stay live. If your source updates by the minute and everyone needs to see the latest numbers without a manual refresh, DirectQuery is the better fit, not Import.
- Not checking column data types after loading. A number imported as text will not work correctly in a chart’s Values field, so it is worth a quick check in the data view before you start building visuals.
You have now loaded your data into Power BI Desktop and are ready to start building visuals. To continue, explore the chart pages in this module, or check out Prwatech’s Power BI training program, which includes placement assistance.
