Blog

Getting Started with Amazon ElastiCache for Redis

Getting Started with Amazon ElastiCache for Redis


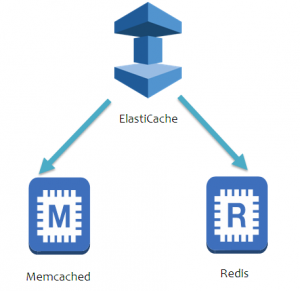
This tutorial will guide you that how to create, granting access to, connect to, and finally delete a Redis (cluster mode disabled) cluster using the ElastiCache Management Console

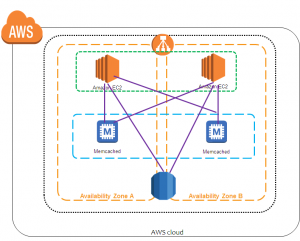
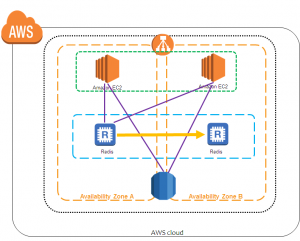
Amazon ElastiCache supports high availability through the use of Redis replication groups.

Starting with Redis version 5.0.5, ElastiCache Redis supports partitioning your data across multiple node groups, with each node group implementing a replication group. This tutorial creates a standalone Redis cluster.


Steps to Create Amazon ElastiCache for Redis Cluster

Determine Requirements

Setting Up

Step 1: Launch a Cluster

#Step 2: Authorize Access

Step 3: Connect to a Cluster’s Node

#Step 4: Delete Your Cluster (To avoid Unnecessary Charges)


Determine Requirements

Before you create a Redis cluster or replication group, you should always determine the requirements for a cluster or replication group so that when you create it, it will meet your business needs and not need to be redone. Because in this exercise we will largely accept default values for the cluster, we will dispense with determining requirements.


Setting Up

Following, you can find topics that describe the one-time actions you must take to start using an ElastiCache.


Topics

Create Your AWS Account

Set Up Your Permissions (New an ElastiCache Users Only)


Create Your AWS Account

To use an Amazon ElastiCache, you must have an active AWS account and permissions to access ElastiCache and other AWS resources.

If you don’t already have an AWS account, create one now. AWS accounts are free. You will not charge for signing up for an AWS service, only for using AWS services.


Set Up Your Permissions (New ElastiCache Users Only)

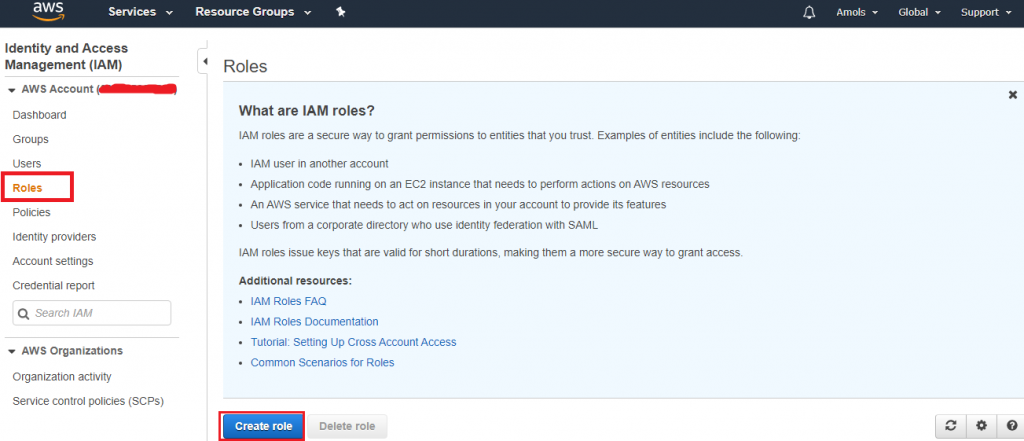
Amazon ElastiCache creates & uses service-linked roles to provision resources and access other AWS resources and services on your behalf. For ElastiCache to create a service-linked role for the user, use the AWS-managed policy named AmazonElastiCacheFullAccess. This role comes pre-provisioned with permission that the service to create a service-linked role on your behalf.

You might decide not to use the default policy and instead to use a custom-managed policy. In this case, make sure that you have either permissions to call iam:createServiceLinkedRole or that you have created an ElastiCache service-linked role.


Using the following

Creating a New Policy (IAM)

AWS-Managed (Predefined) Policies for Amazon ElastiCache

Using Service-Linked Roles for Amazon ElastiCache


Step 1: Launch a Cluster

The cluster you’re about to launch will be live, and not running in the sandbox. You will incur the standard ElastiCache usage fees for the instance until you delete the cluster. The total charges will be minimum (typically less than a dollar) if you complete the exercise described herein one sitting and delete your cluster when you are finished.


Important

Your cluster is launched in an Amazon VPC. Before you start creating your cluster, you need to create a subnet group for the cluster.

To create a standalone Redis (cluster mode disabled/single node) cluster

  1. Sign in to the AWS Management Console and open the Amazon ElastiCache console at https://console.aws.amazon.com/elasticache/.
  2. Choose to Get Started Now.

If you already have an available cluster, select Launch Cluster.

  1. From the list in the upper right corner, choose the AWS Region that you want to launch this cluster in.
  2. For Cluster engine, choose Redis.
  3. Make sure that Cluster-Mode enabled (Scale-Out)is not selected.
  4. Complete the Redis cluster settings section as follows:
    • For Name, type a name for your cluster.


Cluster naming constraints are as follows

Must contain 1 to 40 alphanumeric characters or hyphens.

Must begin with a letter.

It can’t contain two consecutive hyphens.

Can’t end with a hyphen.

From the Engine version compatibility list, choose the Redis engine version you want to run on this cluster. Unless you have a specific reason to run an older version, we recommend that you choose the latest version.

In Port, accept the default port, 6379. If you have a reason to use a different port, enter the port number.

  • From the Parameter group, choose the parameter group you want to use with this cluster, or choose “Create new” to create a new parameter group to use with this cluster. For this exercise, accept the default parameter group.
  • For Node type, choose the node type that you want to use for this cluster. For this exercise, above the table choose the t2instance family, choose t2.micro, and finally choose Save.
  • From the Number of replicas, choose the number of reading replicas you want for this cluster. Because in this tutorial we’re creating a standalone cluster, choose None.

When you select None, the Replication group description field disappears.

  1. Choose Advanced Redis cluster settings and complete the section as follows:

Note

The Advanced Redis cluster settings details are slightly different if you are creating a Redis (cluster mode enabled) replication group.

From the Subnet group list, select the subnet you want to apply to this cluster. For this exercise, choose default.

  1. For the Availability Zone(s), you have two options.
    • No preference: ElastiCache chooses the Availability Zone.
    • Specify availability zones: You specify the Availability Zone for your cluster.

For this exercise, select Specify availability zones and then choose an Availability Zone from the list below Primary.

  • From the Security groups list, select the security groups that you want to use for this cluster. For this exercise, choose default.
  • If you are going to seed your cluster with data from a.RDB file, in the Seed RDB file S3 location box, enters the Amazon S3 location of the.RDB file.
  • Because this is not a production cluster, clear the Enable automatic backups checkbox.
  • The Maintenance window is the time, generally an hour, each week where ElastiCache schedules system maintenance on your cluster. You can allow ElastiCache to specify the day and time for your maintenance window (No preference), or you can specify the day and time yourself (Specify maintenance window. If you select Specify maintenance window, specify the Start day, Start Time, and Duration (in hours) for your maintenance window. For this exercise, choose No preference.
  • For Notifications, leave it as Disabled.
  1. Choose Create cluster to launch your cluster, or Cancel to cancel the operation.


Step 2: Authorize Access

This section considers that you are familiar with launching and connecting to Amazon EC2 instances.

All ElastiCache clusters are designed to be accessed from an Amazon Elastic Compute Cloud (EC2) instance. The most common scenario is to access an ElastiCache cluster from an Amazon Elastic Compute Cloud EC2 instance in the same Amazon Virtual Private Cloud (Amazon VPC). This is the scenario covered in this topic.

The steps required depend upon whether you launched your cluster into EC2-VPC or EC2-Classic.

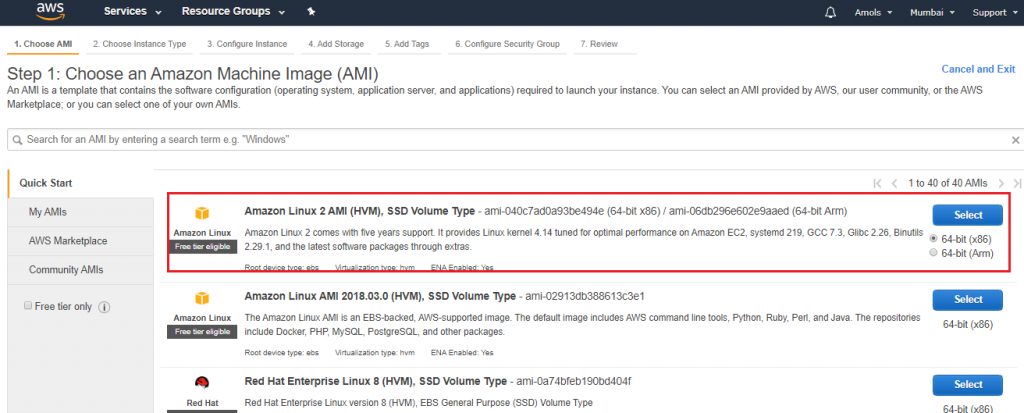
Here I choose Amazon Linux 2 AMI under free tier eligible.

Go to EC2 Dashboard choose AMI

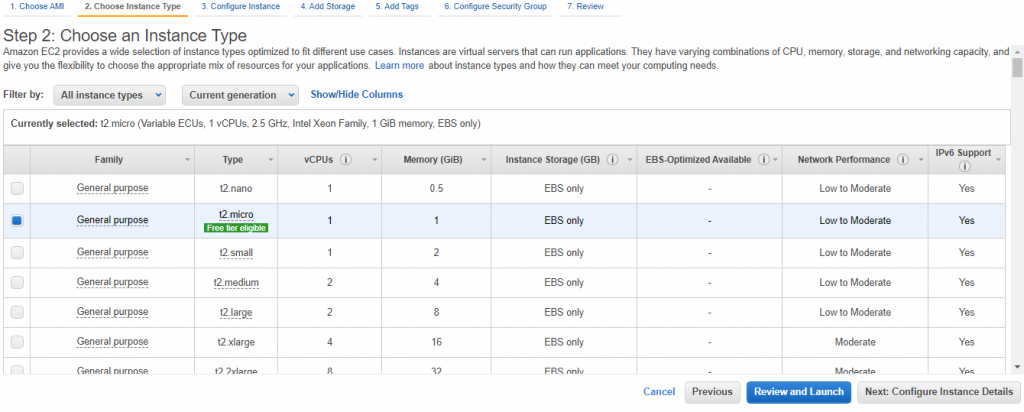
Select the type of instance and click NEXT

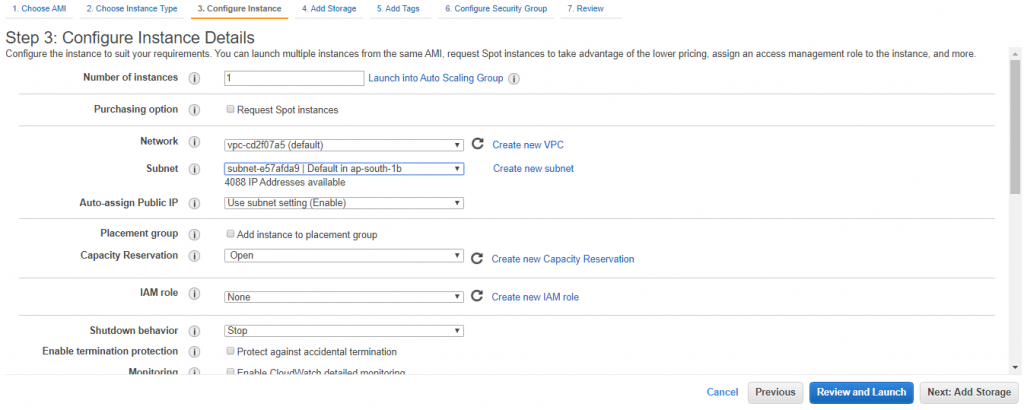
Choose subnet which you have configured in previous steps for Radis cluster and default vpc.


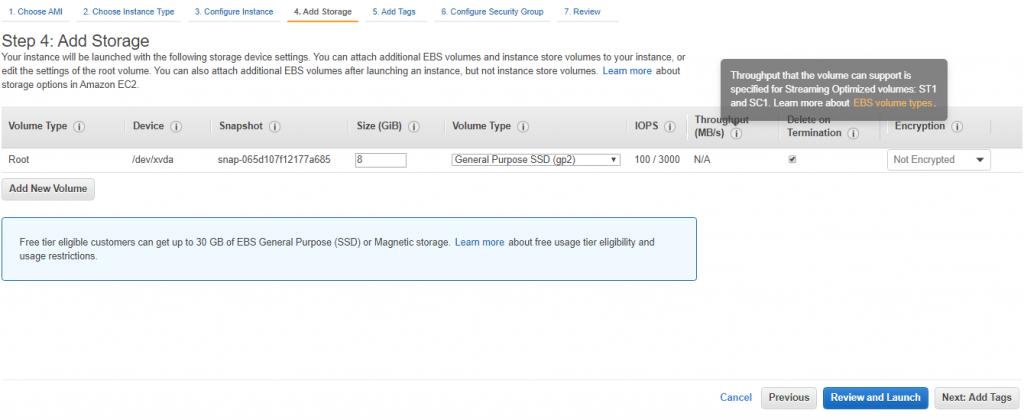
NEXT and add storage


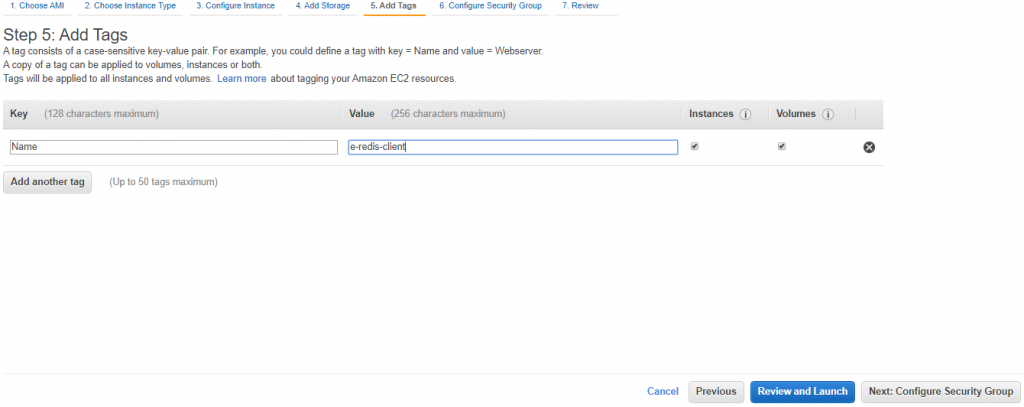
Choose NEXT to add a tag for your EC2 instance


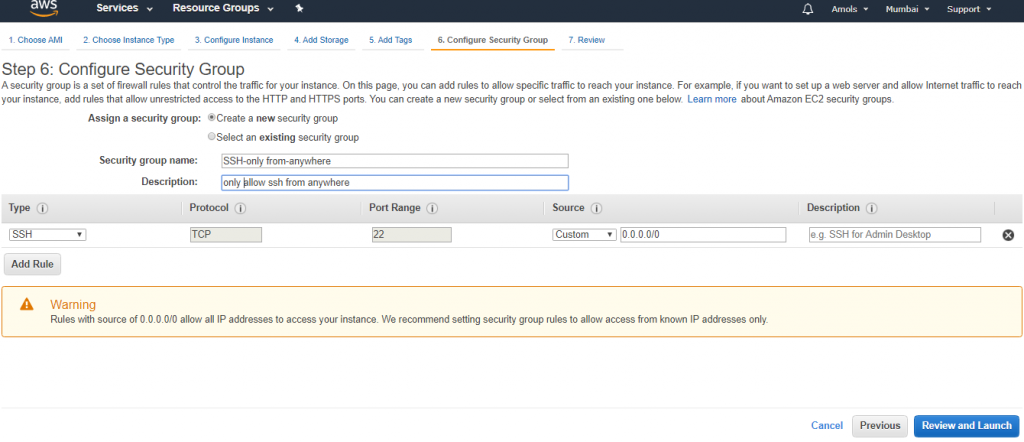
Configure security group for SSH only from access anywhere.


Review and Launch cluster and download key pair

Now connect using your private key. PPK through Putty.exe (for windows user only)

For Linux/ Mac user doesn’t need putty to connect

Now Ec2 instance is running to use for Redis cluster

Redis engine port number is 6379 and to run Redis cluster properly

Set it in the inbound rule under a security group of Redis cluster

Step 3: Connect to a Cluster’s Node

To connect Redis cluster you have to Authorize Access.

This section considers that you’ve created an Amazon EC2 instance and can connect to it.

An Amazon EC2 instance can connect to a cluster node only if you have authorized it in the previous step


Step 3.1: Find your Node Endpoints

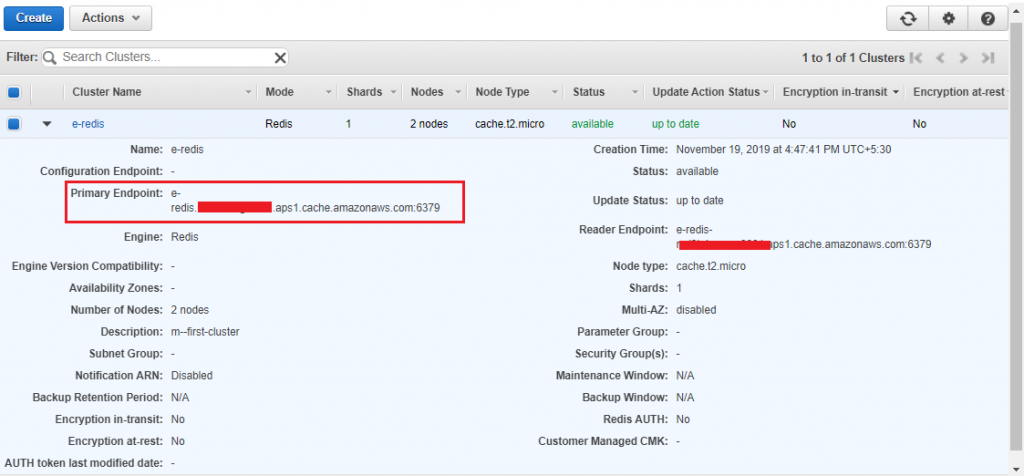
When your cluster is in the available state and you’ve authorized access to it (Step 2: Authorize Access), you can log in to an Amazon EC2 instance and connect to the cluster. To do so, you must first find the endpoint.

When you find the endpoint you require, copy it to your clipboard for use in Step 3.2.


Finding Connection Endpoints

Redis (Cluster Mode Disabled) Cluster’s Endpoints (Console): You need the primary endpoint of a replication group or the node endpoint of a standalone node.

Finding Endpoints for a Redis (Cluster Mode Enabled) Cluster (Console): You need the cluster’s Configuration endpoint.

Endpoints (AWS CLI)

Finding Endpoints (ElastiCache API)


Step 3.2:  To Connect to a Redis Cluster or Replication Group

Now that you have the endpoint you need, you can log in to an EC2 instance and connect to the cluster or replication group.

In the following example, you use the redis-cli utility to connect to a cluster that is not encryption enabled and running Redis.

To connect to a Redis cluster that is not encryption-enabled using redis-cli utility

  1. Connect to your Amazon EC2 instance using the connection utility of your choice.
  2. Download and install the GNU Compiler Collection (GCC).

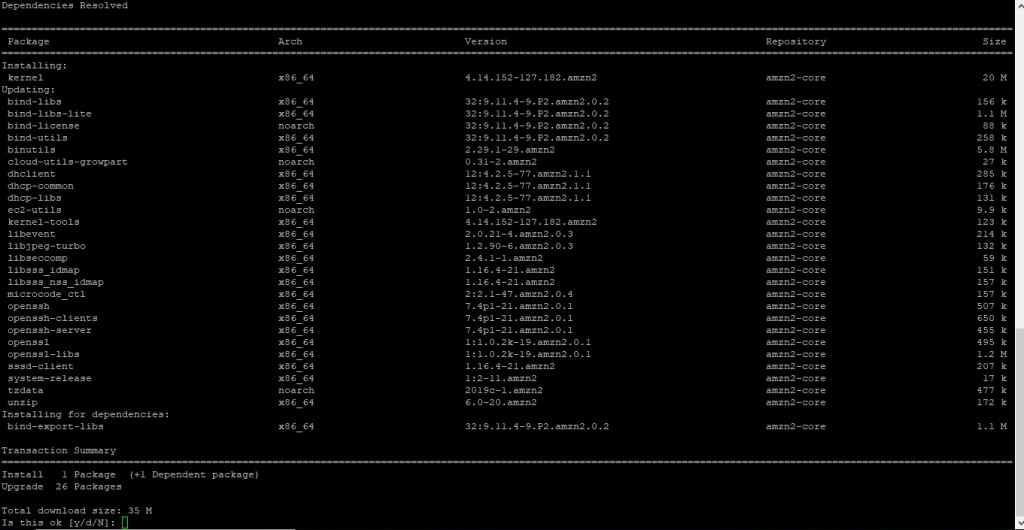
At the command prompt of your EC2 instance, type the following command then, at the confirmation prompt.


sudo yum update

type y

Doing this produces output similar to the following

Type y

  1. Download and compile the redis-cli This utility is included in a Redis software distribution.

At the command prompt of your EC2 instance, type the following commands:


India’s Leading Training institute

Sudo yum install redis

Then type y and hit Enter

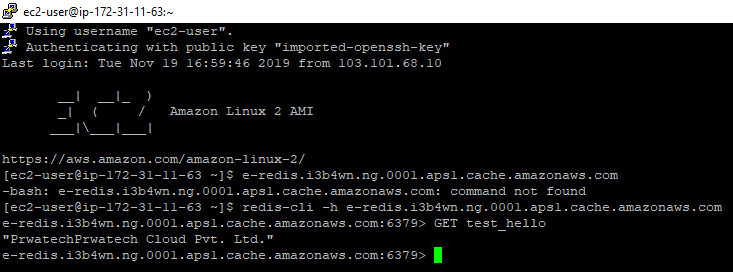
Use redis cli command to ping between EC2 instance and Redis cluster to check the connection

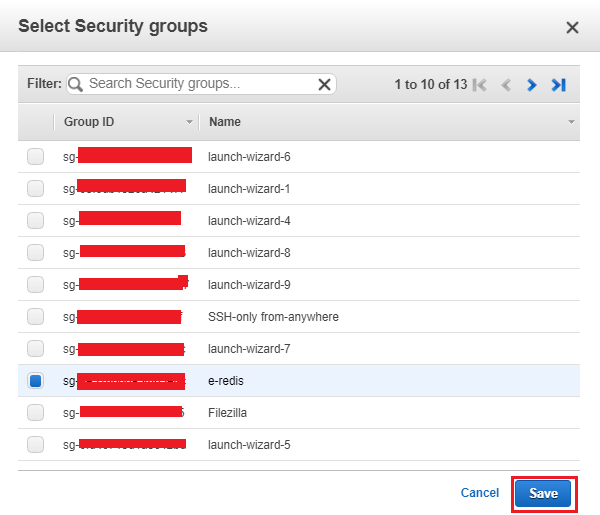
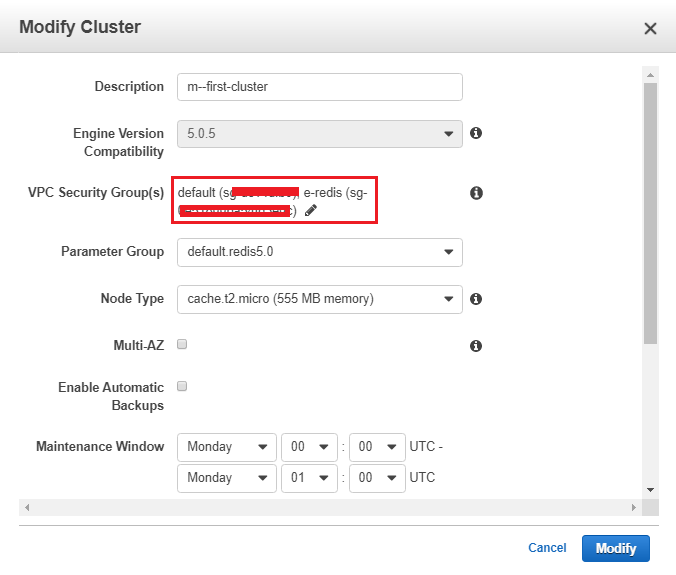
To happen connection, add security group created during redis cluster in the default security group.

For that, you have to modify the cluster

  1. At the command prompt of your EC2 instance, type the following command, substituting the endpoint of your cluster and port for what is shown in this example.

This results in a Redis command prompt similar to the following.

  1. Run Redis commands.

You are now connected to the cluster and can run Redis commands

You can find this on google search for it redis command cheat sheet

Find basic redis command


Type the command similar to the following.

// Set KEY “test_hello” with a string value and no expiration

// Get value for KEY ” test_hello”

You can append KEY and can list all key available

By using the command KEYS_*

quit                   // Exit from redis-cli


You can monitor metrics of redis cluster for CPU utilization engine CPU utilization and swap usage, etc


Step 4: Delete Your Cluster (To Avoid Unnecessary Charges)

Important

It is almost always a good idea to delete clusters that you are not actively using. Until a cluster’s status is deleted, you continue to incur charges for running clusters.

To delete a cluster

  1. Sign in to the AWS Management Console and open the Amazon ElastiCache console at https://console.aws.amazon.com/elasticache/.
  2. To see a list of all your clusters running Redis, in the navigation pane, choose Redis.
  3. To select the cluster to delete, select the cluster’s name from the list of clusters.
  4. For Actions, choose Delete.
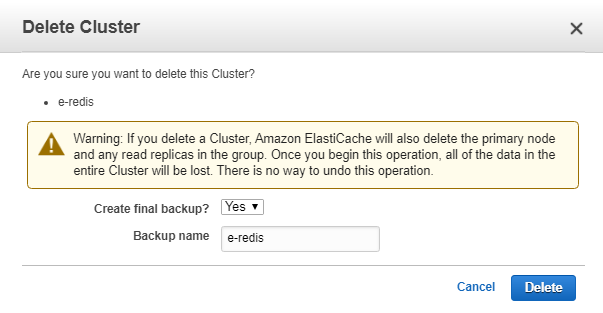
  5. In the Delete Clusterconfirmation screen, choose Delete to delete the cluster, or Cancel to keep the cluster.

If you choose Delete, the status of the cluster changes to deleting.

As soon as your cluster is no longer listed in the list of clusters, you stop incurring charges for it.

Now you have successfully launched, authorized access to, connected to, viewed, and deleted an ElastiCache for Redis cluster.


# Last but not least, always ask for help!


0
0

Elasticsearch Interview Questions and Answers with Examples


Elasticsearch Interview Questions and Answers with Examples

 
Elasticsearch Interview Questions, Are you looking for the list of top Rated Elasticsearch Interview Questions? Or the one who is casually looking for the Best Platform which is offering Best interview questions on Elastic Search? Or the one who is carrying experience seeking the List of best Elasticsearch Interview Questions and Answers with Examples for experienced then stays with us for the most asked interview questions on Elastic Search which are asked in the most common interviews.

Are you the one who is dreaming to become the certified Pro Hadoop Developer? Then ask India’s Leading Big Data Training institute how to become a pro developer. Get the Advanced Big Data Certification course under the guidance of World-class Trainers of Big Data Training institute.
 

1. What is Elasticsearch?

Elasticsearch is a search engine that is based on Lucene. It offers a distributed, multitenant – capable full-text
search engine with as HTTP (HyperText Transfer Protocol) web interface and Schema-free JSON
(JavaScript Object Notation) documents.
It is developed in Java and is an open-source released under Apache License.


2. List the software requirements to install Elasticsearch?

Since Elasticsearch is built using Java, we require any of the following software to run Elasticsearch on our device.
The latest version of Java 8 series
Java version 1.8.0_131 is recommended.


3. How to start an elastic search server?

Run Following command on your terminal to start Elasticsearch server:
CD elasticsearch
./bin/elasticsearch
curl ‘http://localhost:9200/?pretty’ command is used to check the ElasticSearch server is running or not.


4. What is a Cluster in Elasticsearch?

It is a set or a collection of one or more than one nodes or servers that hold your complete data and offers federated indexing and search capabilities across all the nodes. It is identified by a different and
unique name that is “Elasticsearch” by default.
This name is considered to be important because a node can be a part of a cluster only if it is set up to join
the cluster by its name.


5. Can you list some companies that use Elasticsearch?

Some of the companies that use Elasticsearch along with Logstash and Kibana are:
Wikipedia
Netflix
Accenture
Stack Overflow
Fujitsu


6. What is an Index?

An index in Elasticsearch is similar to a table in relational databases. The only difference lies
in storing the actual values in the relational database, whereas that is optional in Elasticsearch.
An index is capable of storing actual or analyzed values in an index


7. What is a Node?

Each and every instance of Elasticsearch is a node. And, a collection of multiple nodes that can work in harmony
form an Elasticsearch cluster.


8. Please Explain Mapping?

Mapping is a process that defines how a document is mapped to the search engine, searchable characteristics
are included such as which fields are tokenized as well as searchable.
In Elasticsearch an index created may contain documents of all “mapping types”.


9. What is a type in Elastic search?

A type in Elasticsearch is a logical category of the index whose semantics are completely up to the user.


10. What is Document?

A document in Elasticsearch is similar to a row in relational databases. The only difference is that every document in an index can have a different structure or field but having the same data type for common fields is mandatory. Each field with different data types can occur multiple times in a document.
The fields can also contain other documents.

India’s Leading Big Data Training Institute

11. What are SHARDS?

There are resource limitations like RAM, vCPU, etc., for scale-out, due to which applications employ multiple
instances of Elasticsearch on separate machines.
Data in an index can be partitioned into multiple portions which are managed by a separate node or instance
of Elasticsearch. Each such portion is called a Shard. And an Elasticsearch index has 5 shards by default.


12. How to add or create an index in ElasticSearch Cluster?

By using the command PUT before the index name, creates the index and if you want to add another index
then use the command POST before the index name.
Ex: PUT website
An index named computer is created


13. What is REPLICAS?

Each shard in elastic search has again two copies of the shard that are called the replicas.
They serve the purpose of fault tolerance and high availability.


14. How to delete an index in Elastic search?

To delete an index in Elasticsearch uses the command DELETE /index name.
Ex: DELETE /website


15. How to add a Mapping in an Index?

Basically, Elasticsearch will automatically create the mapping according to the data provided by the user in the request body. Its bulk functionality can be used to add more than one JSON object in the index.
Ex: POST website /_bulk


16. How to list all indexes of a Cluster in ES.?

By using GET / _index name/ indices we can get the list of indices present in the cluster.


17. How relevancy and scoring are done in Elasticsearch?

The Boolean model is used by Lucene to find similar documents, and a formula called practical scoring
the function is used to calculate the relevance.
This formula copies concepts from the inverse document/term-document frequency and the vector space model
and adds modern features like a coordination factor, field length normalization as well.
Score (q, d) is the relevance score of document “d” for query “q”.


18. How can you retrieve a document by ID in ES.?

To retrieve a document in Elasticsearch, we use the GET verb followed by the _index, _type, _id.
Ex: GET / computer / blog / 123?=pretty


19. List different types of queries supported by Elasticsearch?

The Queries are divided into two types with multiple queries categorized under them.
Full-text queries: Match Query, Match phrase Query, Multi match Query, Match phrase prefix Query,
common terms Query, Query string Query, simple Query String Query.
Term level queries: term Query, term set Query, terms Query, Range Query, Prefix Query, wildcard Query,
regexp Query, fuzzy Query, exists Query, type Query, ids Query.


20. What are the different ways of searching in Elasticsearch?

We can perform the following searches in Elasticsearch:
Multi-index, Multitype search: All search APIs can be applied across all multiple indices with the support for the multi-index system.
We can search for certain tags across all indices as well as all across all indices and all types.
URI search: A search request is executed purely using a URI by providing request parameters.
Request body search: A search request can be executed by a search DSL, that includes the query DSL within the body.


21. How does aggregation work in Elasticsearch?

The aggregation framework provides aggregated data based on the search query. It can be seen as a unit
of work that builds analytic information over the set of documents.
There are different types of aggregations with different purposes and outputs.


22. What is the difference between Term-based and Full-text queries?

Term-based Queries: Queries like the term query or fuzzy query are the low-level queries that do not have the analysis phase. A term Query for the term Foo searches for the exact term in the inverted index and calculates
the IDF/TF relevance score for every document that has a term.
Full-text Queries: Queries like match query or query string queries are the high-level queries that understand that mapping of a field.As soon as the query assembles the complete list of items it executes the appropriate low-level query for every term, and finally combines their results to produce the relevance score of every document.


23. Can Elasticsearch replace the database?

Yes, Elasticsearch can be used as a replacement for a database as the Elasticsearch is very powerful.
It offers features like multi-tenancy, sharding, and Replication, distribution and cloud Realtime get,
Refresh, commit, versioning and re-indexing and many more,
which makes it an apt replacement for a database.


24. Where is Elasticsearch data stored?

Elasticsearch is a distributed documented store with several directories. It can store and retrieve the complex data structures that are serialized as JSON documents in real-time.


25. How to check the elastic search server is running?

Generally, Elasticsearch uses the port range of 9200-9300.
So, to check if it is running on your server just type the URL of the homepage followed by the port number.
Ex: localhost:9200


26. Features of ElasticSearch?

Built on Top of Lucene (A full-text search engine by Apache )
Document-Oriented (Stores data structured JSON documents)
Full-Text Search (Supports Full-text search indexing which giving faster result retrieval)
Schema-Free (Uses NoSQL)
Restful API (Support Restful APIs for storage and retrieval of records)
Supports Autocompletion & Instant Search


27. Does ElasticSearch have a schema?

Yes, ElasticSearch can have mappings that can be used to enforce a schema on documents.


28. What is indexing in ElasticSearch?

The process of storing data in an index is called indexing in ElasticSearch. Data in ElasticSearch can be dividend into write-once and read-many segments. Whenever an update is attempted,
a new version of the document is written to the index.


29. What is an Analyzer in ElasticSearch & its types?

While indexing data in ElasticSearch, data is transformed internally by the Analyzer defined for the index, and then indexed.
An analyzer is built of tokenizer and filters. The following types of Analyzers are available in ElasticSearch 1.10.
1. STANDARD ANALYZER
2. SIMPLE ANALYZER
3. WHITESPACE ANALYZER
4. STOP ANALYZER
5. KEYWORD ANALYZER
6. PATTERN ANALYZER
7. LANGUAGE ANALYZERS
8. SNOWBALL ANALYZER
9. CUSTOM ANALYZER


30. What is a Tokenizer in ElasticSearch?

A Tokenizer breakdown field values of a document into a stream and inverted indexes are created and updated using these values, and these streams of values are stored in the document.


31. What is the query language of ElasticSearch?

ElasticSearch uses the Apache Lucene query language, which is called Query DSL.


32. What Is Inverted Index In Elasticsearch?

Answer: The inverted index is the heart of search engines. The primary goal of a search engine is to provide speedy searches while finding the documents in which our search terms occur.
The inverted index is a hashmap like data structure that directs users from a word to a document or a web page.
It is the heart of search engines. Its main goal is to provide quick searches for finding data from millions of documents.

Usually, in Books, we have inverted indexes as below. Based on the word we can thus find the page on which the word exists.

Consider the following statements

Google is a good website.
Google is one of the good websites.
For indexing purpose, the above text is tokenized into separate terms and all the unique terms are stored
inside the index with information such as in which document this term appears and what is the term position in that document.

So the inverted index for the document text will be as follows-

When you search for the term website OR websites, the query is executed against the inverted index and the terms are looked out for, and the documents where these terms appear are quickly identified.


33. What Is Elasticsearch?

Elasticsearch is a search engine based on Lucene. It provides a distributed, multitenant-capable
full-text search engine with an HTTP web interface and schema-free JSON documents.
Elasticsearch is developed in Java and is released as open-source under the terms of the Apache License.


34. What Are The Basic Operations You Can Perform On A Document?

The following operations can be performed on documents

INDEXING A DOCUMENT USING ELASTICSEARCH.
FETCHING DOCUMENTS USING ELASTICSEARCH.
UPDATING DOCUMENTS USING ELASTICSEARCH.
DELETING DOCUMENTS USING ELASTICSEARCH.


35. Explain Match All Query?

Match all query is the most basic query; it returns all the content and with a score of 1.0 for every object.
Ex.
POST http://localhost:9200/schools*/_search
{
“query”:{
“match_all” : { }
}
}


36. Explain the Match query?

Match query is used to match a text or phrase with the values of one or more fields.
Ex.
POST http://localhost:9200/schools*/_search
{
“query”:{
“match” : {
“city”:”pune”
}
}
}


37. Explain Multi_match query?

multi match query is used to match a text or phrase with more than one field. For example,

POST http://localhost:9200/schools*/_search
{
“query”:{
“multi_match” : {
“query”: “hyderabad”,
“fields”: [ “city”, “state” ]
}
}
}


38. Explain Range Query?

The range query is used to search the objects with values between the ranges of values. For this,
we need to use operators like

gte − greater than equal to
gt − greater-than
lte − less-than equal to
lt − less-than

For example,
{
“query”:{
“range”:{
“rating”:{
“gte”:3.5
}
}
}
}


39. Explain Geo Queries?

These queries deal with geo locations and geo points. These queries help to find out schools or any other
geographical object near to any location. You need to use geo point data type. For example,

{
“query”:{
“filtered”:{
“filter”:{
“geo_distance”:{
“distance”:”100km”,
“location”:[32.052098, 76.649294]
}
}
}
}
}

40. What are Aggregations in ElasticSearch?

Aggregation is a framework that collects all the data selected by the search query.
This framework includes many building blocks to provide support in building complex summaries of the data.


41. How Max aggregation is used?

Max aggregation is used to get the max value of a specific numeric field in aggregated documents. Here’s example,
POST http://localhost:9200/schools/_search
{
“aggs” : {
“max_fees” : { “max” : { “field” : “fees” } }
}
}


42. How Avg Aggregation is done?

Avg aggregation can be used to find the average of any numeric field appear in the aggregated documents. For example,
POST http://localhost:9200/schools/_search
{
“aggs”:{
“avg_fees”:{“avg”:{“field”:”fees”}}
}
}

43. Min aggregation in Elasticsearch?

Min aggregation is used to find the min value of a specific numeric field in aggregated documents. Here’s example,
POST http://localhost:9200/schools*/_search
{
“aggs” : {
“min_fees” : { “min” : { “field” : “fees” } }
}
}


44. Sum aggregation in ElasticSearch.

Sum aggregation is used to calculate the sum of a specific numeric field in aggregated documents. For example,
POST http://localhost:9200/schools*/_search
{
“aggs” : {
“total_fees” : { “sum” : { “field” : “fees” } }
}
}


45. What are the advantages of ElasticSearch?

Elasticsearch is developed on Java, which makes it compatible on almost every platform.
Elasticsearch is real-time, in other words after one second the added document is searchable in this engine.
Elasticsearch is distributed, which makes it easy to scale and integrate into any big organization.
Elasticsearch is creating full backups in an easy way with the concept of the gateway, which is present in Elasticsearch.
Handling multi-tenancy is very easy in Elasticsearch when compared to Apache Solr.
Elasticsearch uses JSON objects as responses, which makes it possible to invoke the Elasticsearch server with a large number of different programming languages.
Elasticsearch supports almost every document type except those that do not support text rendering.
Elasticsearch – Disadvantages
Elasticsearch does not have multi-language support in terms of handling request and response data (only possible in JSON) unlike in Apache Solr, where it is possible in CSV, XML and JSON formats.
Elasticsearch also has a problem with Split-brain situations but in rare cases.


46. Compare Elasticsearch and RDBMS

Elasticsearch index is a collection of type as it is a database which is a collection of tables in RDBMS
(Relation Database Management System). Here each table is a collection of rows as every mapping is a collection of JSON objects Elasticsearch.

Elasticsearch |RDBMS

Index |Database
Shard |Shard
Mapping |Table
Field |Field
JSON Object |Tuple


47. Create Mapping and Add bulk data to that index.

To create mapping and data in Elasticsearch according to the data provided in the request body, use its bulk
functionality to add more than one JSON object in this index.
POST http://localhost:9200/schools/_bulk

{
“index”:{
“_index”:”schools”, “_type”:”school”, “_id”:”1″
}
}
{
“name”:”Central School”, “description”:”CBSE Affiliation”, “street”:”Nagan”,
“city”:”paprola”, “state”:”HP”, “zip”:”176115″, “location”:[31.8955385, 76.8380405],
“fees”:2000, “tags”:[“Senior Secondary”, “beautiful campus”], “rating”:”3.5″
}
{
“index”:{
“_index”:”schools”, “_type”:”school”, “_id”:”2″
}
}
{
“name”:”Saint Paul School”, “description”:”ICSE
Afiliation”, “street”:”Dawarka”, “city”:”Delhi”, “state”:”Delhi”, “zip”:”110075″,
“location”:[28.5733056, 77.0122136], “fees”:5000,
“tags”:[“Good Faculty”, “Great Sports”], “rating”:”4.5″
}


​48. What are the Elasticsearch REST API and use of it?

Elasticsearch provides a very comprehensive and powerful REST API that you can use to interact with your cluster. Among the few things that can be done with the API are as follows:

Check your cluster, node, and index health, status, and statistics
Administer your cluster, node, and index data and metadata
Perform CRUD (Create, Read, Update, and Delete) and search operations against your indexes
Execute advanced search operations viz. aggregations, filtering, paging, scripting, sorting, among many others.


49. What are the Disadvantages of Elasticsearch?

Elasticsearch does not support multiple languages while handling request and response data in JSON.
In rare cases, it has a problem with Split-Brain situations.


50. Explain Joins in ElasticSearch.

In a distributed system like Elasticsearch, performing full SQL-style joins is very expensive. Thus, Elasticsearch provides two forms of join which are designed to scale horizontally.

1) nested query
This query is used for the documents containing nested type fields. Using this query, you can query each object as an independent document.

2) has_child & has_parent queries
This query is used to retrieve the parent-child relationship between two document types within a single index.
The has_child query returns the matching parent documents, while the has_parent query returns the matching child documents.

The following example shows a simple join query:

POST /my_playlist/_search
{
“query”:
{
“has_child” : {
“type” : “kpop”, “query” : {
“match” : {
“artist” : “EXO”
}
}
}
}
}

0
0

Top 50 Tableau Interview Questions And Answers

Top 50 Tableau Interview Questions And Answers


Tableau Interview Questions And Answers, Are you looking for the list of top Rated Tableau Interview Questions And Answers? Or the one who is casually looking for the Best Platform which is offering Best Tableau Interview Questions And Answers? Or the one who is carrying experience seeking for the List of best Tableau Interview Questions And Answers for experienced then stays with us for the most asked interview questions on Tableau which are asked in the most common interviews.

Are you the one who is dreaming to become the certified Pro Tableau Developer? Then ask India’s Leading Tableau Training institute how to become a pro developer. Get the Advanced Tableau Certification course under the guidance of the World-class Trainers of Tableau Training institute.


What is Tableau?

Tableau is a data visualization tool that allows the user to develop an interactive and apt visualization in the form of dashboards, worksheets for the betterment of the business.


Define different parameters in Tableau and their working?

The Tableau parameters are dynamic variables or dynamic values that replace the constant values in data evaluation and filters.
The user can create an evaluated field value that returns true when the score pars the 80, and otherwise false.


Distinguish between parameters and filters in Tableau?

The radical difference actually lies in the application.
The users can dynamically change the dimensions and measures in parameter but filters do not approve the feature.


Explain the fact table and the dimension table?

Fact table:
For instance, a sales category fact table can have a product key, customer key, promotion key referring to a specific event.
Dimension table:
They are the descriptive attribute values for various dimensions of each attribute that define multiple characteristics.
A dimension table referring to a product key from the fact table can consist of a product name, product type, color, size, and description.


What are the limitations of the parameters of Tableau?

The parameters of Tableau can be represent only in four ways on a dashboard. The parameters do not allow any further multiple selections in a filter.


Explain the aggregation and disaggregation of data in Tableau?

Aggregation and disaggregation of data in Tableau are the ways to develop a scatterplot to measure and compare the data values.
Aggregation:
It is calculated in the form of a set of values that return a single numeric value. A default aggregation can be set for any measure which is not user-defined.
Disaggregation:
The disaggregation of data refers to view each data source row during analyzing of data both dependently and independently.


What are context filters and state the limitations of the context filters?

Context filter:
Tableau helps in making the filtering process straightforward and easy.
It does so by creating a hierarchy of filtering, where all the other remaining filters that are present refer to the context filter for all their subsequent operations.
Thus, the remaining filters will now process the data, that is already passed through the context filter.
Development of one or more context filters helps in improving the performance, as the users do not have to create extra filters on the large data source, which actually reduces the query-execution time.

Limitations of context filter:
Generally, Tableau takes a little time for placing a filter in context.


Mention some file extension in Tableau?

There are many file types and extensions in Tableau.
Some of the file extensions in Tableau are:
Tableau Workbook (.twb).
#Tableau Packaged Workbook (.twbx).
Tableau Datasource (.tds).
#Tableau Packaged Datasource (.tdsx).
Tableau Data extract (.tde).
#Tableau Bookmark (.tdm).
Tableau Map Source (.tms).
#Tableau Preferences (.tps)

Building Interactive Dashboards on Tableau


What are the extracts and Schedules in Tableau server?

First copies or subdivisions of the actual data from the original data source are called data extract.
The workbooks which use the data extracts instead of using live DB connections are faster and the extracted data is imported into Tableau engine.
Later after the extraction of data the users can publish the workbooks which publish the extracts in Tableau Server.
And, the scheduled refreshers are the scheduling tasks which are already set for data extract refresh so that they get refreshed automatically while a workbook is published with data extraction.


Mention and explain some components on the dashboard?

Some of the dashboard components are:
Horizontal component: In the dashboard the horizontal component’s containers allow the designer to combine the worksheets and dashboards components from left to right across the user’s page and the height of the elements is edited at once.
Vertical component: In the dashboard Vertical component’s containers allows the user to combine the worksheets and dashboard components from left to right across the user’s page and the width of the elements are edited at once.
Text: It is an alphabetical order.
Image Extract: A Tableau is in XML format. In the case of extracting images, Tableau applies the codes to extract an image that can be stored in XML.
Web [URL ACTION]: A Web URL action is a certain type of hyperlink that directs to a web page always or to any other web-based resource that is residing outside of Tableau. The user can hence use the URL actions for linking up more information about the user’s data, which might be hosted outside of the user’s data source. In order to make the link relevant to the user data, the user can substitute field values of a selection into the URL as parameters.


How would you define a dashboard?

A dashboard is an information management device that visually tracks, analyzes and shows key performance indicators (KPI), measurements and main points which focus on the screen to monitor the health of a business, division or particular process. They are adaptable to meet the particular needs of a department and company. A dashboard is the most proficient approach to track numerous data sources since it gives a central area to organizations to screen and examine performance.


What is a Column Chart?

A Column chart is a realistic graphical representation of data. Column charts show vertical bars going over the chart on a horizontal plane, axis having values are display on the left-hand side of the graph.


What is the Page shelf?

the name recommends, the page shelf parts the view into a series of pages, displaying an alternate view on each page, making it easier to understand and minimizing scrolling to analyze and see information and data.


What is a bin?

Bin is a user-defined gathering of measures in the information source. It is conceivable to make bins concerning measurement, or numeric bins. You could consider the State field as various sets of bins each profit value is arranged into a bin comparing to the state from which the value was recorded. But then also, if you want to look out values for Profit assigned to bins without reference to measurement, you can make a numeric bin, with every individual bin relating to the scope of values.


Difference between Tiled and Floating in Tableau Dashboards

Tiled items are organized in a single layer grid that modifies in a measure, which is based on the total dashboard size and the objects around it. Floating items could be layered on top of other objects and can have a permanent size and position.
Floating Layout While most questions are tiled on this dashboard, the map view and its related color legend are floating. They are layered on top of the bar graph, which utilizes a tiled layout.


What are the Filter Actions?

Filler activities send data in-between worksheets. Normally, filler actions transmit data from a selected mark to another sheet indicating related data. In the background, filler activities send information values from the pertinent source fields as filters to the target sheet.


What are the Aggregation and Disaggregation?

Aggregation and Disaggregation in Tableau are the approaches to build up a scatter plot to look at and measure data values.
Aggregation Data
When you put a measure on a shelf, Tableau consequently totals the information, generally by summing it. Disaggregating Data
Disaggregating your information enables you to see each line of the information source, which can be helpful when you are breaking down measures that you might need to utilize both freely and conditionally in the view.


What is Assume referential integrity?

In Database terms, each row in the certainty table will contain a combination roe in the measurement table. Utilizing this strategy, we manufacture Primary and Foreign Keys for joining two tables. By choosing Assume Referential Integrity, you reveal to Tableau that the joined tables have referential integrity. In other word, you are confirming that the fact table will dependably have a coordinating row in the Dimension table.


Where can you use global filters?

Global filters can be utilized as a part of sheets, dashboards, and stories.


What is the Context Filter?

Context filter is an extremely productive filter from all of the filters in Tableau. It enhances the performance in Tableau by making a Sub-Set of information for the filter selection.
Context Filters serve two principal purposes.
Improves execution: If you set a lot of filters or have an expansive information source, the inquiries can be slow. You can set at least one context filter to enhance the execution.
Develops top N filter you could set a context filter to incorporate just the data of interest, and after that set a numerical or a best N filter.


What are the Limitations of context filters?

Here are some of the limitations of context filters:
The client doesn’t regularly change the context filter – if the filter is changed the database must re-process and rewrite the transitory table, slowing performance.
When you set measurement to context, Tableau makes a transitory table that will require a reload each time the view is started.


What is data visualization?

Data visualization is a demonstration if the information in a pictorial or graphical form. It empowers decision-makers to have look analytics presented visually, so they can get a handle on challenging ideas or create new patterns. With intelligent visualization, you can make the idea a stride further by utilizing technology to draw them into diagrams and charts for more detail.


Why did you choose data visualization?

Data visualization is a fast, simple to pass on ideas universally and you can explore different scenarios by making slight alterations.

Explain about Actions in Tableau?

Tableau enables you to add context and intuitiveness to your information utilizing actions. There are three types of actions in Tableau: Filter, Highlight, and URL activities
Filter actions enable you to utilize the information in one view to filter data in another as you make guided systematic stories.
Highlight actions enable you to point out external resources.
URL actions enable you to point to external resources, for example, a site page, document, or another Tableau worksheet.


Describe the Tableau Architecture?

Tableau has exceptionally adaptable, and it has an n-level customer server-based design that serves mobile customers, web customers, and desktop installed software. Tableau desktop is approving, and publishing tools used to make an offer the views on the tableau server.


What is Authentication on Server?

An authentication server is an application that encourages authentication of an element that endeavors to get to a network. Such an entity might be a human client or another server.


Why do you publish a data source and workbooks?

By publishing you can start to do the following:
Collaborate and offer with others
Centralize information and database driver administration
Support portability


What makes up a published data source?

The data connection information that depicts what information you need to acquire to Tableau for analysis. When you associate with the data in Tableau Desktop, you can make joins, including joints between tables from various data types. You can rename fields on the Data Source page to be more expressive for the people who work with your distributed data source.


What is Hyper?

Hyper is an extremely high-performance in-memory information engine innovation that enables clients to analyze large or complex informational sets speedier, by proficiently assessing analytically questions specifically in the value-based database. A core Tableau stage innovation, Hyper utilizes restrictive unique code generation and cutting edge parallelism procedures to accomplish quick execution for the separate creation and question execution.


What is VizQL?

VizQL is a visual inquiry language that interprets simplified activities into data questions and after that communicates that information visually.
VizQL conveys dramatic gains in individuals’ capacity to see and understand information by abstracting the hidden complexities of question and analysis.
The result is an instinctive user encounter that gives people to answer questions as quickly as they can consider them.


What is a LOD expression?

LOD Expressions give way to effectively compute aggregations that are not at the level of detail of the visualization. You would then be able to coordinate those values inside visualization in arbitrary ways.


What is a Gantt chart?

A Gantt chart is a valuable graphical device, which demonstrates tasks or activities performed against time. It is also called the visual presentation of a task where the activities are separated and shown on a chart, which makes it is straightforward and interpret.


What is a Histogram chart?

A histogram is a plot that gives you a chance to find, and show, the basic frequency (shape) of an arrangement of continuous information. This allows the examination of the information for its hidden distribution, anomalies, sleekness, and so on.


What are the sets?

Sets are custom fields that characterize a subset of information based on few conditions. A set can be founded on a processed condition, for instance, a set may contain clients with sales over a specific edge. Computed sets update as your information changes. Then again, a set can be founded on a particular information point in your view.


What are the groups?

A group is a blend of measurement members that make a higher amount of categories. For instance, if you are working with a view that shows normal test scores by major, you might need to group certain majors to make real categories.


When do we use Join vs. blend?

If information locates in a single source, it is constantly desirable to utilize Joins. At the point when your information isn’t in one place blending is the most feasible way to make a left join like the association between your primary and auxiliary data sources.


What is a Stacked Bar chart?

A stacked bar chart is a chart that utilizes bars to indicate correlations between categories of information, however with the capacity to break down and look at parts of an entirety. Each bar in the chart speaks to an entire, and fragments in the bar speak to various parts or classes of that whole.


What is the Scatter Plot?

The scatter plot diagrams are sets of numerical information, with one variable on every axis, to search for a relationship between them. If the factors correspond, the points will fall along a line or bend. The better the connection, the more tightly the points will attach to the line.


What is a Waterfall chart?

An average waterfall chart is utilize to indicate how an initial value is expand and diminish by a series of intermediate values, prompting a final value. A waterfall chart is a type of information perception that helps in understanding the total impact of consecutively presented positive or negative values. These values can either be time-dependent or category based.


What is a TreeMap?

A treemap is a visual technique for showing various leveled information that utilizations settled rectangles to speak to the branches of a tree chart. Every rectangle has a territory corresponding to the amount of information it speaks.


What are the interactive dashboards?

Dashboards which empower us to connect with different components like channels, parameters, activities and cut up the information to show signs of improvement experiences or answer complex questions.


What are the different site roles we can assign to a client in Tableau?

Site roles are approval sets that are assign to a client, for example, System Administrator, Publisher, or Viewer. The site roles characterize accumulations of capacities that can be to clients or groups on Tableau Server. General site roles, which we can assign to a client are as follows-:
Server Administrator: This role has full access to all servers and functionality of the website, all content on the server, and all clients.
Site Administrator: By assigning this role one can manage groups, activities, projects, workbooks and information sources for the site.
Publisher: Publishers can sign in, communicate with published views and publish dashboards to Tableau server from the desktop.


What are Table Calculations?

It is a change you apply to the values of a single measure in your view, based on measurements in the level of detail.


What is a Published data source?

Published data sources are not all that simple to utilize. Various item defects or design oversights could have frustrated the appropriation of server-based data sources.
Publishing data sources to the server enable us to
Centralize information sources
Share them with all the validated clients
Increase workbook uploading/publishing speed
Schedule information update with described frequency


What is a Hierarchy in Tableau?

The hierarchy in Tableau gives drill down activity to the Tableau report. With the assistance of tiny + and – symbols, we can explore from a larger level to a settled level or lower level. When you interface with an information source, Tableau consequently separates date fields into hierarchies so you can without much of a stretch separate the viz. You can also make your particular hierarchies.


What is a marked card in Tableau?

The Marks card is a key component for visual examination in Tableau. As you drag fields to different properties in the Marks card, you add setting and detail to the marks in the view. You utilize the Marks card to set the mark write and to encode your information with size, color, text, shape, and detail.


What is a Tableau data sheet?

After you interface with your information and set up the information source with Tableau, the data source associations and fields show up on the left half of the workbook in the Datasheet.


What is a Bullet graph?

A bullet graph is a variety of a bar graph create by Stephen Few. Propelled by the traditional thermometer diagrams and advance bars found in numerous dashboards, the bullet graph fills in as a substitution for dashboard gauges and meters.

What is a Choropleth Map?

This gives an approach to visualize values over a geographical region, which can indicate a variety of patterns over the displayed area.


How would you improve dashboard execution?

Here are some of the ways to improve dashboard execution:
Utilize an extract Extracts are an easy way and fastest approach to make most workbooks run quicker.
Reduce the scope whether you’re making a view, dashboard, or story, it’s enticing to pack a considerable measure of data into your visualization since it’s so natural to add more fields and calculations to the view and more sheets to the workbook. So, therefore, the result can be that the visualization turns out to be slower and slower to render. Utilize Context filter-making at least one context filter enhances execution as clients don’t need to make additional channels on an extensive data source, reducing the question execution time.

0
0

Top 50 R Interview Questions and Answers

Top 50 R Interview Questions and Answers

How can you load a .csv file in R?

Loading a .csv file in R is quite easy.
All you need to do is use the “read.csv()” function and specify the path of the file.

house<-read.csv(“C://house.csv”)


What are the different components of the grammar of graphics?

1. Data layer
2.Aesthetics layer
3. Geometry layer
4. Facet layer
5. Coordinate layer
6. Themes layer


What is Rmarkdown? What is the use of it?

RMarkdown is a reporting tool provided by R. With the help of Rmarkdown, you can create high-quality reports of your R code.
The output format of Rmarkdown can be:

1. HTML
2. PDF
3. WORD

R-Programming Tutorials


Name some packages in R, which can be used for data imputation?

1. MICE
2. Amelia
3. missForest
4. Hmisc
5. Mi
6. imputeR
7. Name some functions available in “dplyr” package.
8. filter
9. select
10 .mutate
11. arrange
12. count


R – Variable


Tell me something about shinyR?

Ans) Shiny is an R package that makes it easy to build interactive web apps straight from R. You can host standalone apps on a webpage or embed them in Rmarkdown documents or build dashboards. You can also extend your Shiny apps with CSS themes, htmlwidgets, and JavaScript actions.


What packages are used for data mining in R?

Some packages used for data mining in R:

1. data.table- provides a fast reading of large files
2. rpart and caret- for machine learning models.
3. Arules- for association rule learning.
4. GGplot- provides various data visualization plots.
5. tm- to perform text mining.
6. Forecast- provides functions for time series analysis


R – Bar Charts


What do you know about the rattle package in R?

Answer)Rattle is a popular GUI for data mining using R. It presents statistical and visual summaries of data, transforms data so that it can be readily modeled, builds both unsupervised and supervised machine learning models from the data, presents the performance of models graphically, and scores new datasets for deployment into production. A key feature is that all of your interactions through the graphical user interface are captured as an R script that can be readily executed in R independently of the Rattle interface.


Name some functions which can be used for debugging in R?

Answer)

1. traceback()
2. debug()
3. browser()
4. trace()
5. recover()


R – Importing data from tab delim


What is R?

Answer) This should be an easy one for data science job applicants. R is an open-source language and environment for statistical computing and analysis, or for our purposes, data science.


Can you write and explain some of the most common syntaxes in R?

Answer) Again, this is an easy—but crucial—one to nail. For the most part, this can be demonstrated through any other code you might write for other R interview questions, but sometimes this is asked as a standalone. Some of the basic syntax for R that’s used most often might include:
# — as in many other languages, # can be used to introduce a line of comments. This tells the compiler not to process the line, so it can be used to make code more readable by reminding future inspectors what blocks of code are intended to do.
“” — quotes operate as one might expect; they denote a string data type in R.
<- — one of the quirks of R, the assignment operator is <- rather than the relatively more familiar use of =. This is an essential thing for those using R to know, so it would be good to display your knowledge of it if the question comes up.
\ — the backslash, or reverse virgule, is the escape character in R. An escape character is used to “escape” (or ignore) the special meaning of certain characters in R and, instead, treat them literally.


R – Importing data from tab delim


What are some advantages of R?

Answer) It’s important to be familiar with the advantages and disadvantages of certain languages and ecosystems. R is no exception.


what are the advantages of R?

Its open-source nature. This qualifies as both an advantage and disadvantage for various reasons, but being open source means it’s widely accessible, free to use, and extensible.
Its package ecosystem. The built-in functionality available via R packages means you don’t have to spend a ton of time reinventing the wheel as a data scientist.
Its graphical and statistical aptitude. By many people’s accounts, R’s graphing capabilities are unmatched.


R – Importing data from tab delim


What are the disadvantages of R?

Answer) Just as you should know what R does well, you should understand its failings.
Memory and performance.
In comparison to Python, R is often said to be the lesser language in terms of memory and performance.
This is disputable, and many think it’s no longer relevant as 64-bit systems dominate the marketplace.

Related: Our list of Python Interview Questions and Answers

Open-source. Being open-source has its disadvantages as well as its advantages. For one, there’s no governing body managing R, so there’s no single source for support or quality control. This also means that sometimes the packages developed for R are not the highest quality.
Security. R was not built with security in mind, so it must rely on external resources to mind these gaps.


R-Histograms


Write code to accomplish a task?

Answer) In just about an interview for a position that involves coding, companies will ask you to accomplish a specific task by actually writing code. Facebook and Google both do as much. Because it’s difficult to predict what task an interviewer will set you to, just be prepared to write “whiteboard code” on the fly


What are the different data types/objects in R?

Answer) This is another good opportunity to show that you know R, and you’re not winging it. Unlike other object-oriented languages such as C, R doesn’t ask users to declare a data type when assigning a variable. Instead, everything in R correlates to an R data object. When you assign a variable in R, you assign it a data object and that object’s data type determines the data type of the variable. The most commonly used data objects include:

1. Vectors
2. Matrices
3. Lists
4. Arrays
5. Factors
6. Data frames


R – Dataframe


What are the objects you use most frequently?

Answer) This question is meant to gather a sense of your experiences in R. Simply think about some recent work you’ve done in R and explain the data objects you use most often. If you use arrays frequently, explain why and how you’ve used them.


Why use R?

Answer) This is a variant of the “advantages of R” question. Reasons to use R include its open-source nature and the fact that it’s a versatile tool for statistical plotting, analysis, and portrayal. Don’t be afraid to give some personal reasons as well. Maybe you simply love the assignment operator in R or feel that it’s more elegant than other languages—but always remember to explicate. You should be answering follow-up questions before they’re even asked.


R – pie charts


What are some of your favorite functions in R?

Answer) As a user of R, you should be able to come up with some functions on the spot and describe them. Functions that save time and, as a result, the money will always be something an interviewer likes to hear about.


What is a factor variable, and why would you use one?

Answer) A factor variable is a form of the categorical variable that accepts either numeric or character string values. The most salient reason to use a factor variable is that it can be used in statistical modeling with great accuracy. Another reason is that they are more memory efficient.
Simply use the factor() function to create a factor variable


R – Scatterplots


Which data object in R is used to store and process categorical data?

Answer) The Factor data objects in R are used to store and process categorical data in R.


How do you get the name of the current working directory in R?

Answer) The command getwd() gives the current working directory in the R environment.

What makes a valid variable name in R?

Answer) A valid variable name consists of letters, numbers and the dot or underline characters. The variable name starts with a letter or the dot not followed by a number.


R – Boxplots


What is the main difference between an Array and a matrix?

Answer) A matrix is always two dimensional as it has only rows and columns. But an array can be of any number of dimensions and each dimension is a matrix. For example, a 3x3x2 array represents 2 matrices each of dimension 3×3.


Which data object in R is used to store and process categorical data?

Answer) The Factor data objects in R are used to store and process categorical data in R


What is the recycling of elements in a vector? Give an example.

Answer) When two vectors of different lengths are involved in operation then the elements of the shorter vector are reused to complete the operation. This is called element recycling. Example – v1 <- c(4,1,0,6) and V2 <- c(2,4) then v1*v2 gives (8,4,0,24). The elements 2 and 4 are repeated


R – Package


What is a lazy function evaluation in R?

Answer) The lazy evaluation of a function means, the argument is evaluated only if it is used inside the body of the function. If there is no reference to the argument in the body of the function then it is simply ignored.


Name R packages that are used to read XML files?

Answer) The package named “XML” is used to read and process the XML files.


Can we update and delete any of the elements in a list?

Answer) The general expression to create a matrix in R is – matrix(data, nrow, ncol, byrow, dimnames)


R – Operators


What is the reshaping of data in R?

Answer) In R the data objects can be converted from one form to another. For example, we can create a data frame by merging many lists. This involves a series of R commands to bring the data into the new format. This is called data reshaping.


What does unlist() do?

Answer) It converts a list to a vector.


How do you convert the data in a JSON file to a data frame?

Answer) Using the function as.data.frame()


What is the use of apply() in R?

Answer) It is used to apply the same function to each of the elements in an Array. For example, finding the mean of the rows in every row.


R – Lists


How to find the help page on missing values?

Answer) ?NA

How do you get the standard deviation for a vector x?

Answer) sd(x, na.rm=TRUE)


How do you set the path for the current working directory in R?

Answer) setwd(“Path”)


What is the difference between “%%” and “%/%”?

Answer) “%%” gives the remainder of the division of the first vector with second while “%/%” gives the quotient of the division of the first vector with the second.


What does col.max(x) do?

Answer) Find the column has the maximum value for each row.


Give the command to create a histogram.

Answer) hist()


How do you remove a vector from the R workspace?

Answer) rm(x)


List the data sets available in package “MASS”

Answer) data(package = “MASS”)


List the data sets available in all available packages.

Answer) data(package = .packages(all.available = TRUE))


R – Data structure


What is the use of the command – install.packages(file.choose(), repos=NULL)?

Ans) It is used to install an r package from a local directory by browsing and selecting the file.


What is the use of the “next” statement in R?

Ans) The “next” statement in R programming language is useful when we want to skip the current iteration of a loop without terminating it.
Two vectors X and Y are defined as follows – X <- c(3, 2, 4) and Y <- c(1, 2).


What will be the output of vector Z that is defined as Z <- X*Y.

Ans) In R language when the vectors have different lengths, the multiplication begins with the smaller vector and continues till all the elements in the larger vector have been multiplied.
The output of the above code will be –
Z <- (3, 4, 4)


R language has several packages for solving a particular problem. How do you make a decision on which one is the best to use?

Answer) The CRAN package ecosystem has more than 6000 packages. The best way for beginners to answer this question is to mention that they would look for a package that follows good software development principles. The next thing would be to look for user reviews and find out if other data scientists or analysts have been able to solve a similar problem.


Explain the significance of transpose in R language

Answer) Transpose t () is the easiest method for reshaping the data before analysis.


What are with () and BY () functions used for?

Answer) With () function is used to apply an expression for a given dataset and BY () function is used for applying a function each level of factors.
dplyr package is used to speed up the data frame management code. Which package can be integrated with dplyr for large fast tables?
Answer) data.table

0
0

Top 50 Machine Learning Interview Questions and Answers


Top 50 Machine Learning Interview Questions and Answers


Q1) You are given a train data set having 1000 columns and 1 million rows. The data set is based on a classification problem. Your manager has asked you to reduce the dimension of this data so that model computation time can be reduced. Your machine has memory constraints. What would you do?

Answer: Processing a high dimensional data on a limited memory machine is a strenuous task, your interviewer would be fully aware of that. The following are the methods you can use to tackle.

such a situation:
Since we are having low RAM, we should close all other applications in our machine, including the web browser, so that most of the memory can be put to use.
We can randomly sample the data set. This means we can create a smaller data set, let’s say, having 1000 variables and 300000 rows and do the computations.
To reduce dimensionality, we can separate the numerical and categorical variables and remove the correlated variables. For numerical variables, we’ll use correlation. For categorical variables, we’ll use the chi-square test.
Also, we can use and pick the components which can explain the maximum variance in the data set.
Using online learning algorithms like Vowpal Wabbit (available in Python) is a possible option.
Building a linear model using Stochastic Gradient Descent is also helpful.
We can also apply our business understanding to estimate which all predictors can impact the response variable. But, this is an intuitive approach, failing to identify useful predictors might result in a significant loss of information.


Q2. Is rotation necessary in PCA? If yes, Why? What will happen if you don’t rotate the components?

Answer: Yes, rotation (orthogonal) is necessary because it maximizes the difference between variance captured by the component. This makes the components easier to interpret. Not to forget, that’s the motive of doing PCA where we aim to select fewer components (than features) which can explain the maximum variance in the data set. By doing rotation, the relative location of the components doesn’t change, it only changes the actual coordinates of the points.
If we don’t rotate the components, the effect of PCA will diminish and we’ll have to select the number of components to explain variance in the data set.


Q3. You are given a data set. The data set has missing values that spread along 1 standard deviation from the median. What percentage of data would remain unaffected? Why?

Answer: This question has enough hints for you to start thinking! Since the data is spread across the median, let’s assume it’s a normal distribution. We know, in a normal distribution, ~68% of the data lies in 1 standard deviation from mean (or mode, median), which leaves ~32% of the data unaffected. Therefore, ~32% of the data would remain unaffected by missing values.


Q4. You are given a data set on cancer detection. You’ve built a classification model and achieved an accuracy of 96%. Why shouldn’t you be happy with your model performance? What can you do about it?

Answer: If you have worked on enough data sets, you should deduce that cancer detection results in imbalanced data. In an imbalanced data set, accuracy should not be used as a measure of performance because 96% (as given) might only be predicting majority class correctly, but our class of interest is minority class (4%) which is the people who actually got diagnosed with cancer. Hence, in order to evaluate model performance, we should use Sensitivity (True Positive Rate), Specificity (True Negative Rate), F measure to determine the class-wise performance of the classifier. If the minority class performance is found to be poor, we can undertake the following steps:
We can use undersampling, oversampling or SMOTE to make the data balanced.
We can alter the prediction threshold value by doing and finding an optimal threshold using the AUC-ROC curve.
We can assign a weight to classes such that the minority classes get larger weight.
We can also use anomaly detection.


Q5. Why is naive Bayes so ‘naive’?

Answer: naive Bayes is so ‘naive’ because it assumes that all of the features in a data set are equally important and independent. As we know, these assumptions are rarely true in a real-world scenario.


Q6. Explain prior probability, likelihood and marginal likelihood in the context of naiveBayes algorithm?

Answer: Prior probability is nothing but, the proportion of dependent (binary) variable in the data set. It is the closest guess you can make about a class, without any further information.
For example: In a data set, the dependent variable is binary (1 and 0). The proportion of 1 (spam) is 70% and 0 (not spam) is 30%. Hence, we can estimate that there are 70% chances that any new email would be classified as spam.
The likelihood is the probability of classifying a given observation as 1 in the presence of some other variable.
For example, the probability that the word ‘FREE’ is used in the previous spam message is a likelihood. The marginal likelihood is the probability that the word ‘FREE’ is used in any message.


Q7. You are working on a time series data set. Your manager has asked you to build a high accuracy model. You start with the decision tree algorithm since you know it works fairly well on all kinds of data. Later, you tried a time series regression model and got higher accuracy than the decision tree model. Can this happen? Why?

Answer: Time series data is known to possess linearity. On the other hand, a decision tree algorithm is known to work best to detect non – linear interactions. The reason why the decision tree failed to provide robust predictions because it couldn’t map the linear relationship as good as a regression model did. Therefore, we learned that a linear regression model can provide robust prediction given the data set satisfies its linearity assumptions


Q8. You are assigned a new project which involves helping a food delivery company to save more money. The problem is, the company’s delivery team isn’t able to deliver food on time. As a result, their customers get unhappy. And, to keep them happy, they end up delivering food for free. Which machine learning algorithm can save them?

Answer: You might have started hopping through the list of ML algorithms in your mind. But, wait! Such questions are asked to test your machine learning fundamentals. This is not a machine learning problem. This is a route optimization problem. A machine learning problem consists of three things:
1. There exist a pattern.
2. You cannot solve it mathematically (even by writing exponential equations).
3. You have data on it.
Always look for these three factors to decide if machine learning is a tool to solve a particular problem.


Q9. You came to know that your model is suffering from low bias and high variance. Which algorithm should you use to tackle it? Why?

Answer: Low bias occurs when the model’s predicted values are near to actual values. In other words, the model becomes flexible enough to mimic the training data distribution. While it sounds like a great achievement, but not to forget, a flexible model has no generalization capabilities. It means, when this model is tested on unseen data, it gives disappointing results.
In such situations, we can use the bagging algorithm (like random forest) to tackle high variance problems. Bagging algorithms divide a data set into subsets made with repeated randomized sampling. Then, these samples are used to generate a set of models using a single learning algorithm. Later, the model predictions are combined using voting (classification) or averaging (regression).
Also, to combat high variance, we can:
Use the regularization techniques, where higher model coefficients get penalized, hence lowering model complexity.
Use top n features from the variable importance chart. Maybe, with all the variables in the data set, the algorithm is having difficulty in finding a meaningful signal.


Q10. You are given a data set. The data set contains many variables, some of which are highly correlated and you know about it. Your manager has asked you to run PCA. Would you remove correlated variables first? Why?

Answer: Chances are, you might be tempted to say No, but that would be incorrect. Discarding correlated variables have a substantial effect on PCA because, in the presence of correlated variables, the variance explained by a particular component gets inflated.
For example, You have 3 variables in a data set, of which 2 are correlated. If you run PCA on this data set, the first principal component would exhibit twice the variance than it would exhibit with uncorrelated variables. Also, adding correlated variables lets PCA put more importance on those variables, which is misleading.
 

Top 50 Machine Learning Interview Questions and Answers


Q11. After spending several hours, you are now anxious to build a high accuracy model. As a result, you build 5 GBM models, thinking a boosting algorithm would do the magic. Unfortunately, neither of the models could perform better than the benchmark score. Finally, you decided to combine those models. Though ensembled models are known to return high accuracy, you are unfortunate. Where did you miss it?

Answer: As we know, ensemble learners are based on the idea of combining weak learners to create strong learners. But, these learners provide superior results when the combined models are uncorrelated. Since we have used 5 GBM models and got no accuracy improvement, it suggests that the models are correlated. The problem with correlated models is, all the models provide the same information
For example: If model 1 has classified User1122 as 1, there are high chances model 2 and model 3 would have done the same, even if its actual value is 0. Therefore, ensemble learners are built over the premise of combining weak uncorrelated models to obtain better predictions.


Q12. How is kNN different from kmeans clustering?

Answer: Don’t get mislead by ‘k’ in their names. You should know that the fundamental difference between both these algorithms is, kmeans is unsupervised in nature and kNN is supervised in nature. kmeans is a clustering algorithm. kNN is a classification (or regression) algorithm.
kmeans algorithm partitions a data set into clusters such that a cluster formed is homogeneous and the points in each cluster are close to each other. The algorithm tries to maintain enough separability between these clusters. Due to unsupervised nature, the clusters have no labels. kNN algorithm tries to classify an unlabeled observation based on its k (can be any number ) surrounding neighbors. It is also known as a lazy learner because it involves minimal training of the model. Hence, it doesn’t use training data to make a generalization on the unseen data sets.


Q13. How is True Positive Rate and Recall related? Write the equation?

Answer: True Positive Rate = Recall. Yes, they are equal having the formula (TP/TP + FN).


Q14. You have built a multiple regression model. Your model R² isn’t as good as you wanted. For improvement, you remove the intercept term, your model R² becomes 0.8 from 0.3. Is it possible? How?

Answer: Yes, it is possible. We need to understand the significance of the intercept term in a regression model. The intercept term is showing model prediction without any independent variable i.e. mean prediction.
The formula of
R² = 1 – Σ(y – y´)²/Σ(y – ymean)²
where y´ is predicted value.

When the intercept term is present, the R² value evaluates your model wrt. to the mean model. In absence of intercept term ( ymean), the model can make no such evaluation, with large denominator, Σ(y – y´)²/Σ(y)² equation’s value becomes smaller than actual, resulting in higher R².


Q15. After analyzing the model, your manager has informed us that your regression model is suffering from multicollinearity. How would you check if he’s true? Without losing any information, can you still build a better model?

Answer: To check multicollinearity, we can create a correlation matrix to identify & remove variables having a correlation above 75% (deciding a threshold is subjective). In addition, we can use calculate VIF (variance inflation factor) to check the presence of multicollinearity.
VIF value<= 4 suggests no multicollinearity whereas a value of >= 10 implies serious multicollinearity. Also, we can use tolerance as an indicator of multicollinearity.
But, removing correlated variables might lead to loss of information. In order to retain those variables, we can use penalized regression models like ridge or lasso regression. Also, we can add some random noise in the correlated variables so that the variables become different from each other. But, adding noise might affect the prediction accuracy, hence this approach should
be carefully used.


Q16. When is Ridge regression favorable over Lasso regression?

Answer: You can quote ISLR’s authors Hastie, Tibshirani who asserted that, in the presence of few variables with medium / large sized effect, use lasso regression. In presence of many variables with small/medium-sized effects, use ridge regression.
Conceptually, we can say, lasso regression (L1) does both variable selection and parameter shrinkage, whereas Ridge regression only does parameter shrinkage and end up including all the coefficients in the model. In the presence of correlated variables, ridge regression might be the preferred choice. Also, ridge regression works best in situations where the east square estimates have higher variance. Therefore, it depends on our model objective.


Q17. The rise in global average temperature led to a decrease in the number of pirates around the world. Does that mean that a decrease in the number of pirates caused climate change?

Answer: After reading this question, you should have understood that this is a classic case of “causation and correlation”. No, we can’t conclude that the decrease in the number of pirates caused climate change because there might be other factors (lurking or confounding variables) influencing this phenomenon. Therefore, there might be a correlation between global average temperature and number of pirates, but based on this information we can’t say that pirated died because of the rise in global
average temperature.


Q18. While working on a data set, how do you select important variables? Explain your methods?

Answer:
Following are the methods of variable selection you can use:
1. Remove the correlated variables prior to selecting important variables
2. Use linear regression and select variables based on p values
3. Use Forward Selection, Backward Selection, Stepwise Selection
4. Use Random Forest, Xgboost and plot variable importance chart
5. Use Lasso Regression
6. Measure information gain for the available set of features and select top n features accordingly.


Q19. What is the difference between covariance and correlation?

Answer:
Correlation is the standardized form of covariance.
Covariances are difficult to compare. For example: if we calculate the covariances of salary ($) and age (years), we’ll get different covariances that can’t be compared because of having unequal scales. To combat such a situation, we calculate correlation to get a value between -1 and 1, irrespective of their respective scale.


Q20. Is it possible to capture the correlation between continuous and categorical variables? If yes, how?

Answer:
Yes, we can use ANCOVA (analysis of covariance) technique to capture the association between continuous and categorical variables.


Q21. Both being a tree-based algorithm, how is random forest different from the Gradient boosting algorithm (GBM)?

Answer:
The fundamental difference is, random forest uses bagging techniques to make predictions. GBM uses boosting techniques to make predictions.
In the bagging technique, a data set is divided into n samples using randomized sampling.
Then, using a single learning algorithm a model is built on all samples. Later, the resultant predictions are combined using voting or averaging. Bagging is done in parallel. In boosting, after the first round of predictions, the algorithm weighs misclassified predictions higher, such that they can be corrected in the succeeding round. This sequential process of giving higher weights to misclassified predictions continues until a stopping criterion is reached.
Random forest improves model accuracy by reducing variance (mainly). The trees grown are uncorrelated to maximize the decrease in variance. On the other hand, GBM improves accuracy my reducing both bias and variance in a model
 

Top 50 Machine Learning Interview Questions and Answers


Q22. Running a binary classification tree algorithm is the easy part. Do you know how does a tree splitting takes place i.e. how does the tree decide which variable to split at the root node and succeeding nodes?

Answer:
A classification tree makes the decision based on the Gini Index and Node Entropy. In simple words, the tree algorithm finds the best possible feature which can divide the data set into purest possible children nodes.
Gini index says, if we select two items from a population at random then they must be of the same
class and the probability for this is 1 if the population is pure. We can calculate Gini as following:
1. Calculate Gini for sub-nodes, using the formula sum of the square of probability for success and failure
(p^2+q^2).
2. Calculate Gini for split using weighted Gini score of each node of that split
Entropy is the measure of impurity as given by (for binary class):

Here p and q is the probability of success and failure respectively in that node. Entropy is zero when a node is homogeneous. It is maximum when both the classes are present in a node at 50% – 50%. Lower entropy is desirable.


Q23. You’ve built a random forest model with 10000 trees. You got delighted after getting training error as 0.00. But, the validation error is 34.23. What is going on? Haven’t you trained your model perfectly?

Answer:
The model has overfitted. Training error 0.00 means the classifier has minimized the training data patterns to an extent, that they are not available in the unseen data. Hence, when this classifier was run on an unseen sample, it couldn’t find those patterns and returned a prediction with higher error. In a random forest, it happens when we use a larger number of trees than necessary. Hence, to avoid these situations, we should tune the number of trees using cross-validation.


Q24. You’ve got a data set to work having p (no. of variable) > n (no. of observation). Why is OLS as a bad option to work with? Which techniques would be best to use? Why?

Answer: In such high dimensional data sets, we can’t use classical regression techniques, since their assumptions tend to fail. When p > n, we can no longer calculate a unique least-square coefficient estimate, the variances become infinite, so OLS cannot be used at all.
To combat this situation, we can use penalized regression methods like lasso, LARS, ridge which can shrink the coefficients to reduce variance. Precisely, ridge regression works best in situations where the least square estimates have higher variance.
Among other methods include subset regression, forward stepwise regression.


Q25. What is the convex hull? (Hint: Think SVM)

Answer: In the case of linearly separable data, the convex hull represents the outer boundaries of the two groups of data points. Once the convex hull is created, we get maximum margin hyperplane (MMH) as a perpendicular bisector between two
convex hulls.

MMH is the line which attempts to create the greatest
the separation between two groups.


Q26. We know that one hot encoding increasing the dimensionality of a data set. But, label encoding doesn’t. How?

Answer:
Don’t get baffled at this question. It’s a simple question asking the difference between the two.
Using one hot encoding, the dimensionality (a.k.a features) in a data set get increased because it creates a new variable for each level present in categorical variables. For example: let’s say we have a variable ‘color’. The variable has 3 levels namely Red, Blue, and Green. One hot encoding ‘color’ variable will generate three new variables as Color. Red, Color.Blue and Color.Green
containing 0 and 1 value.
In label encoding, the levels of categorical variables get encoded as 0 and 1, so no new variable is created. Label encoding is majorly used for binary variables.


Q27. What cross-validation technique would you use on the time series data set? Is it k-fold or LOOCV?

Answer:
Neither. In time series problem, k fold can be troublesome because there might be some pattern in year 4 or 5 which is not in year 3. Resampling the data set will separate these trends, and we might end up validation in past years, which is incorrect. Instead, we can use forward chaining
strategy with 5 fold as shown below:

fold 1: training [1], test [2]
fold 2: training [1 2], test [3]
fold 3: training [1 2 3], test [4]
fold 4: training [1 2 3 4], test [5]
fold 5: training [1 2 3 4 5], test [6]
where 1,2,3,4,5,6 represents “year”.


Q28. You are given a data set consisting of variables having more than 30% missing values? Let’s say, out of 50 variables, 8 variables have missing values higher than 30%. How will you deal with them?

Answer:
We can deal with them in the following ways:
1. Assign a unique category to miss values, who knows the missing values might decipher some trend
2. We can remove them blatantly.
3. Or, we can sensibly check their distribution with the target variable, and if found any pattern we’ll keep those missing values and assign them a new category while removing others.


29. ‘People who bought this, also bought…’ recommendations seen on amazon is a result of which algorithm?

Answer: The basic idea for this kind of recommendation engine comes from a collaborative filtering algorithm that considers “User Behavior” for recommending items. They exploit the behavior of other users and items in terms of transaction history, ratings, selection, and purchase information. Other user’s behavior and preferences over the items are used to recommend items to the new users. In this case, features of the items are not known.


Q30. What do you understand by Type I vs Type II error?

Answer:
Type I error is committed when the null hypothesis is true and we reject it, also known as a ‘False Positive’. Type II error is committed when the null hypothesis is false and we accept it, also known as ‘False Negative’. In the context of the confusion matrix, we can say Type I error occurs when we classify a value as positive (1) when it is actually negative (0). Type II error occurs when we classify a value as negative (0) when it is actually positive(1).


Q31. You are working on a classification problem. For validation purposes, you’ve randomly sampled the training data set into train and validation. You are confident that your model will work incredibly well on unseen data since your validation accuracy is high. However, you get shocked after getting poor test accuracy. What went wrong?

Answer:
In the case of classification problems, we should always use stratified sampling instead of random sampling. A random sampling doesn’t take into consideration the proportion of target classes. On the contrary, stratified sampling helps to maintain the distribution of the target variables in the resultant distributed samples also.


Q32. You have been asked to evaluate a regression model based on R², adjusted R², and tolerance. What will be your criteria?

Answer:
Tolerance (1 / VIF) is used as an indicator of multicollinearity. It is an indicator of
percent of the variance in a predictor that cannot be accounted for by other predictors. Large values of tolerance are desirable.
We will consider adjusted R² as opposed to R² to evaluate model fit because of R² increases irrespective of improvement in prediction accuracy as we add more variables. But, adjusted R² would only increase if an additional variable improves the accuracy of the model, otherwise, it stays the same. It is difficult to commit a general threshold value for adjusted R² because it varies between data sets.

For example, a gene mutation data set might result in lower adjusted R² and still provide fairly good predictions, as compared to a stock market data where lower adjusted R² implies that the model is not good.


Q33. In k-means or kNN, we use euclidean distance to calculate the distance between nearest neighbors. Why not manhattan distance?

Answer:
We don’t use manhattan distance because it calculates distance horizontally or
vertically only. It has dimension restrictions. On the other hand, euclidean metric can be used in any space to calculate distance. Since the data points can be present in any dimension, euclidean distance is a more viable option.
Example: Think of a chess board, the movement made by a bishop or a rook is calculated by manhattan distance because of their respective vertical & horizontal movements


Q34. Explain machine learning to me like a 5-year-old.

Answer:
It’s simple. It’s just like how babies learn to walk. Every time they fall down, they learn (unconsciously) & realize that their legs should be straight and not in a bend position. The next time they fall down, they feel pain. They cry. But, they learn ‘not to stand like that again’. In order to avoid that pain, they try harder. To succeed, they even seek support from the door or wall or anything near them, which helps them stand firm.
This is how a machine works & develops intuition from its environment.
Note: The interview is only trying to test if have the ability to explain complex concepts in simple
terms.


Q35. I know that a linear regression model is generally evaluated using Adjusted R² or F value. How would you evaluate a logistic regression model?

Answer:
We can use the following methods:
1. Since logistic regression is used to predict probabilities, we can use the AUC-ROC curve along with the confusion matrix to determine its performance.
2. Also, the analogous metric of adjusted R² in logistic regression is AIC. AIC is the measure of fit which penalizes the model for the number of model coefficients. Therefore, we always prefer the model with minimum AIC value.
3. Null Deviance indicates the response predicted by a model with nothing but an intercept.
Lower the value, better the model. Residual deviance indicates the response predicted by a model on adding independent variables. Lower the value, better the model.


Q36. Considering the long list of the machine learning algorithm, given a data set, how do you decide which one to use?

Answer:
You should say, the choice of machine learning algorithm solely depends on the type of data. If you are given a data set which is exhibits linearity, then linear regression would be the best algorithm to use. If you have given to work on images, audios, then the neural networks would help you to build a robust model.
If the data comprises of nonlinear interactions, then a boosting or bagging algorithm should be the choice. If the business requirement is to build a model that can be deployed, then we’ll use regression or a decision tree model (easy to interpret and explain) instead of black-box algorithms like SVM, GBM, etc.
In short, there is no one master algorithm for all situations. We must be scrupulous enough to understand which algorithm to use.


Q37. Do you suggest that treating a categorical variable as a continuous variable would result in a better predictive model?

Answer:
For better predictions, the categorical variable can be considered as a continuous variable only when the variable is ordinal in nature.


Q38. When does regularization become necessary in Machine Learning?

Answer:
Regularization becomes necessary when the model begins to overfit/underfit. This technique introduces a cost term for bringing in more features with the objective function.
Hence, it tries to push the coefficients for many variables to zero and hence reduce the cost term.
This helps to reduce model complexity so that the model can become better at predicting (generalizing).


Q39. What do you understand by Bias Variance trade-off?

Answer:
The error emerging from any model can be broken down into three components mathematically.
Following are these component:

Bias error is useful to quantify how much on an average are the predicted values different from the actual value. A high bias error means we have an under-performing model that keeps on missing important trends. Variance on the other side quantifies how are the prediction made on the same observation different from each other. A high variance model will over-fit on your training population and perform badly on any observation beyond training.


Q40. OLS is too linear regression. The maximum likelihood is logistic regression. Explain the statement.?

Answer:
OLS and Maximum likelihood are the methods used by the respective regression methods to approximate the unknown parameter (coefficient) value. In simple words, Ordinary least square(OLS) is a method used in linear regression which approximates the parameters resulting in minimum distance between actual and predicted values. Maximum Likelihood helps in choosing the values of parameters which maximizes the likelihood that the parameters are most likely to produce observed data.


Q41. Difference between Arima and Sarima Model?

Ans: what’s Wrong with ARIMA
Autoregressive Integrated Moving Average, or ARIMA, is a forecasting method for univariate time series data.
As its name suggests, it supports both autoregressive and moving average elements. The integrated element refers to differencing allowing the method to support time-series data with a trend.
A problem with ARIMA is that it does not support seasonal data. That is a time series with a repeating cycle.
ARIMA expects data that is either not seasonal or has the seasonal component removed, e.g. seasonally adjusted via methods such as seasonal differencing.
The parameters of the ARIMA model are defined as follows:
•p: The number of lag observations included in the model, also called the lag order.
•d: The number of times that the raw observations are differenced also called the degree of difference.
•q: The size of the moving average window, also called the order of moving average.


Q42.Difference between AIC And BIC?

Ans.
Akaike information criterion (AIC) (Akaike, 1974) is a fined technique based on in-sample fit to estimate the likelihood of a model to predict/estimate the future values.
A good model is the one that has minimum AIC among all the other models. The AIC can be used to select between the additive and multiplicative Holt-Winters models.
Bayesian information criterion (BIC) (Stone, 1979) is another criteria for model selection that measures the trade-off between model fit and complexity of the model. A lower AIC or BIC value indicates a better fit.
AIC and BIC are both penalized-likelihood criteria. Both are of the form “measure of fit + complexity penalty”:
AIC = -2*ln(likelihood) + 2*p, and BIC = -2*ln(likelihood) + ln(N)*p,
where p = number of estimated parameters, N = sample size
•AIC is best for prediction as it is asymptotically equivalent to cross-validation.
•BIC is best for an explanation as it allows consistent estimation of the underlying data generating process
AIC is equivalent to K-fold cross-validation, BIC is equivalent to leve-one-out cross-validation.


Q43.Difference between AUC and ROC?

Ans. In Machine Learning, performance measurement is an essential task. So when it comes to a classification problem, we can count on an AUC – ROC Curve.
When we need to check or visualize the performance of the multi – class classification problem, we use AUC (Area Under The Curve) ROC (Receiver Operating Characteristics) curve. It is one of the most important evaluation metrics for checking any classification model’s performance. It is also written as AUROC (Area Under the Receiver Operating Characteristics)
The ROC curve is plotted with TPR against the FPR where TPR is on y-axis and FPR is on the x-axis.


Q44. What is the Confusion Matrix and why you need it?

Well, it is a performance measurement for machine learning classification problem where output can be two or more classes. It is a table with 4 different combinations of predicted and actual values.

It is extremely useful for measuring Recall, Precision, Specificity, Accuracy and most importantly AUC-ROC Curve.


Q45.Explain naive Bayes and when it will use and how?

Ans. Naive Bayes performs well when we have multiple classes and working with text classification. Advantage of Naive Bayes algorithms are:
It is simple and if the conditional independence assumption actually holds, a Naive Bayes classifier will converge quicker than discriminative models like logistic regression, so you need less training data. And even if the NB assumption doesn’t hold.
It requires less model training time.
The main difference between Naive Bayes(NB) and Random Forest (RF) is their model size. Naive Bayes model size is low and quite constant with respect to the data. The NB models cannot represent complex behavior so they won’t get into overfitting. On the other hand, the Random Forest model size is very large and if not carefully built, it results in overfitting. So, when your data is dynamic and keeps changing. NB can adapt quickly to the changes and new data while using an RF you would have to rebuild the forest every time something changes.
from sklearn.naive_bayes import GaussianNB


Q46. difference between k means clustering and knn algorithm?

K-nearest neighbors algorithm (k-NN) is a supervised method used for classification and regression problems. However, it is widely used in classification problems. It makes predictions by learning from the past available data.
Supervised Technique
Used for Classification or Regression
Used for classification and regression of known data where usually the target attribute/variable is known beforehand.
KNN needs labeled points

K- Means clustering is used for analyzing and grouping data which does not include pre-labeled class or even a class attribute at all.
Unsupervised Technique
Used for Clustering
Used for scenarios like understanding the population demographics, social media trends, anomaly detection, etc.
K-Means doesn’t require labeled points


Q 47. How does the K-means algorithm work?

In unsupervised learning, the data is not labeled so consider the unlabelled data. Our task is to group the data into two clusters.

This is our data; the first thing we can do is to randomly initialize two points, called the cluster centroids.

In k-means we do two things. First is a cluster assignment step and second is a move centroid step.

In the first step, the algorithm goes to each of the data points and divides the points into respective classes, depending on whether it is closer to the red cluster centroid or green cluster centroid.

In the second step, we move the centroid step. We compute the mean of all the red points and move the red cluster centroid there. We do the same thing for the green cluster.
This is an iterative step so we do the above step till the cluster centroid will not move any further and the colors of the point will not change any further.

KNN is a supervised learning algorithm which means training data is labeled. Consider the task of classifying a green circle between class 1 and class 2.

If we choose k=1, then the green circle will go into class 1 as it is closer to class 1. If K=3, then there are ‘two’ class 2 objects and ‘one’ class one object. So KNN will classify the green circle in class 2 as it forms the majority.


Q 48. How will you avoid overfitting and underfitting and hence build a robust model?

Avoid overfitting.
Cross-Validation: A standard way to find out-of-sample prediction error is to use 5-fold cross-validation.
Early Stopping: Its rules provide us the guidance 5as to how many iterations can be run before the learner begins to over-fit.
Pruning: Pruning is extensively used while building-related models. It simply removes the nodes which add little predictive power for the problem in hand.
Regularization: It introduces a cost term for bringing in more features with the objective function. Hence it tries to push the coefficients for many variables to zero and hence reduce cost term


Q49. How is Random Forest different from GBM, both being tree based?

Ans. GBM and RF both are ensemble learning methods and predict (regression or classification)
RFs train each tree independently, using a random sample of the data. This randomness helps to make the model more robust than a single decision tree, and less likely to overfit on the training data
RF is much easier to tune than GBM. There are typically two parameters in RF: number of trees and number of features to be selected at each node.
RF is harder to overfit than GBM.
The main limitation of the Random Forests algorithm is that a large number of trees may make the algorithm slow for real-time prediction.
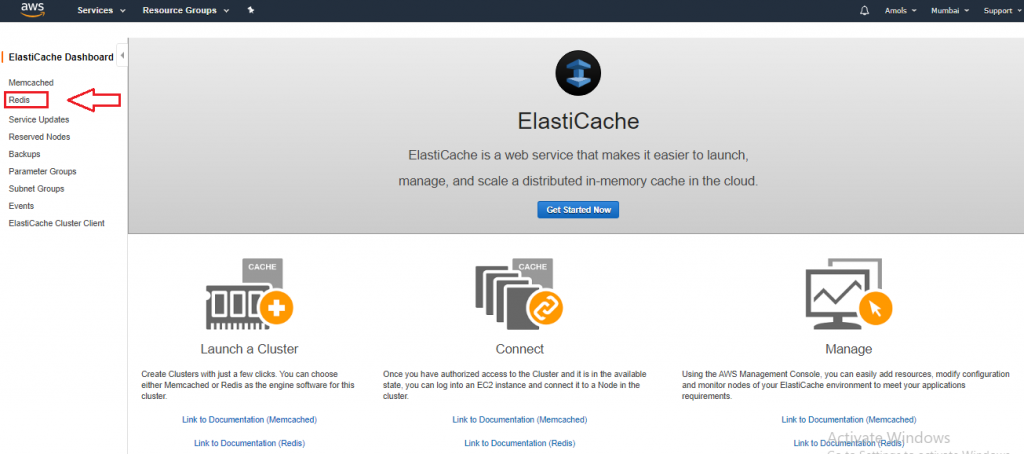
 

0
0

Top 50 Data Science Interview Questions and Answers with Examples


Data Science Interview Questions and answers

Data Science Interview Questions and answers, are you looking for the best interview questions on Data science? Or hunting for the best platform which provides a list of Top Rated interview questions on Data science for experienced? Then stop hunting and follow Best Data science Training Institute for the List of Top-Rated Data science interview questions and answers for experienced for which are useful for both Fresher’s and experienced.

Are you the one who is a hunger to become Pro certified Data science Developer then ask your Industry Certified Experienced Data science Trainer for more detailed information? Don’t just dream to become Pro-Developer Achieve it learning the Data science Course under world-class Trainer like a pro. Follow the below-mentioned interview questions on Data science with answers to crack any type of interview that you face.

Q1. What is inferential statistics?

It generates larger data and applies probability theory to draw a conclusion


Q2. What is the mean value of statistics?

Mean is the average value of the data set.


Q3. What is Mode value in statistics?

The Most repeated value in the data set


Q4. What is the median value in statistics?

The middle value from the data set


Q5. What is the Variance in statistics?

Variance measures how far each number in the set is from the mean.

Data Science Tutorials


Q6. What is Standard Deviation in statistics?

It is the square root of the variance


Q7. How many types of variables are there in statistics?

1. Categorical variable
2. Confounding variable
3. Continuous variable
4. Control variable
5. Dependent variable
6. Discrete variable
7. Independent variable
8. Nominal variable
9. Ordinal variable
10. Qualitative variable
11. Quantitative variable
12. Random variables
13. Ratio variables
14. ranked variables


Q8. How many types of distributions are there?

1. Bernoulli Distribution
2. Uniform Distribution
3. Binomial Distribution
4. Normal Distribution
5. Poisson Distribution
6. Exponential Distribution


Q9. What is normal distribution ?

A) It’s like a bell curve distribution. Mean, Mode and Medium are equal in this distribution. Most of the distributions in statistics are a normal distribution.


Q10. What is the standard normal distribution?

If mean is 0 and the standard deviation is 1 then we call that distribution as the standard normal distribution.


Q11. What is Binomial Distribution?

A distribution where only two outcomes are possible, such as success or failure and where the probability of success and failure is the same for all the trials then it is called a Binomial Distribution


Q12. What is the Bernoulli distribution?

A Bernoulli distribution has only two possible outcomes, namely 1 (success) and 0 (failure), and a single trial.


Q13. What is the Poisson distribution?

A distribution is called Poisson distribution when the following assumptions are true:

1. Any successful event should not influence the outcome of another successful event.
2. The probability of success over a short interval must equal the probability of success over a longer interval.
3. The probability of success in an interval approaches zero as the interval becomes smaller.


Q14. What is the central limit theorem?

a) The mean of the sample means is close to the mean of the population
b) Standard deviation of the sample distribution can be found out from the population standard deviation divided by the square root of sample size N and it is also known as the standard error of means.
c) if the population is not a normal distribution, but the sample size is greater than 30 the sampling distribution of sample means approximates a normal distribution


Q15. What is P-Value, How it’s useful?

The p-value is the level of marginal significance within a statistical hypothesis test representing the probability of the occurrence of a given event.
If the p-value is less than 0.05 (p<=0.05), It indicates strong evidence against the null hypothesis, you can reject the Null Hypothesis
If the P-value is higher than 0.05 (p>0.05), It indicates weak evidence against the null hypothesis, you can fail to reject the null Hypothesis


Q16. What is Z value or Z score (Standard Score), How it’s useful?

Z score indicates how many standard deviations on the element is from the mean. It is also called the standard score.

Z score Formula:

z = (X – μ) / σ
It is useful in Statistical testing.
Z-value is ranged from -3 to 3.
It’s useful to find the outliers in large data


Q17. What is T-Score, What is the use of it?

It is a ratio between the difference between the two groups and the differences within the groups. The larger the score, the more difference there is between groups. The smaller t-score means the more similarity between groups.
We can use t-score when the sample size is less than 30, It is used in statistical testing


Q18. What is IQR ( Interquartile Range ) and Usage?

It is the difference between 75th and 25th percentiles, or between upper and lower quartiles,
It is also called Miss Spread data or Middle 50%.
Mainly to find outliers in data, if the observations that fall below Q1 − 1.5 IQR or above Q3 + 1.5 IQR those are considered as outliers.
Formula IQR = Q3-Q1


Q19. What is Hypothesis Testing?

Hypothesis testing is a statistical method that is used in making statistical decisions using experimental data. Hypothesis Testing is basically an assumption that we make about the population parameter.
How many Types of Hypothesis Testing are there?
Null Hypothesis and Alternative Hypothesis


Q20. What is a Type 1 Error?

FP – False Positive ( In statistics it is the rejection of a true null hypothesis)


Q21. What is a Type 2 Error?

FN – False Negative ( In statistics it is failing to reject a false null hypothesis)


Q22. What is Univariate, Bivariate, Multivariate Analysis ?

Univarite means single variable – Analysis on single variable data
Bivariate means two variables – you can do analysis on multiple variables
Multi-Variate means multiple variables – Analysis of multiple variables


Q23. Explain the difference between Type I error & Type II error.

Ans. Type I and type II errors are part of the process of hypothesis testing.
Type I errors happen when we reject a true null hypothesis.
Type II errors happen when we fail to reject a false null hypothesis.


Q24. What is Accuracy?

Ans. Accuracy is a metric by which one can examine how good is the machine learning model. Let us look at the confusion matrix to understand it in a better way:

So, the accuracy is the ratio of correctly predicted classes to the total classes predicted. Here, the accuracy will be:


Q25 What is Z-test?

Ans. Z-test determines to what extent a data point is away from the mean of the data set, in standard deviation. For example:
Principal at a certain school claims that the students in his school are above average intelligence. A random sample of thirty students has a mean IQ score of 112. The mean population IQ is 100 with a standard deviation of 15. Is there sufficient evidence to support the principal’s claim?
So we can make use of a z-test to test the claims made by the principal. Steps to perform z-test:
Stating the null hypothesis and alternative hypothesis.
State the alpha level. If you don’t have an alpha level, use 5% (0.05).
Find the rejection region area (given by your alpha level above) from the z-table. An area of .05 is equal to a z-score of 1.645.
Find the test statistics using this formula:

Here,
x ̅is the sample mean
σ is population standard deviation
n is sample size
μ is the population mean
If the test statistic is greater than the z-score of the rejection area, reject the null hypothesis. If it’s less than that z-score, you cannot reject the null hypothesis.
To get a better understanding of the topic, refer here.


Q26. What is Ordinal Variable?

Ans. Ordinal variables are those variables that have discrete values but have some order involved. Refer here.


Q27. What is Continuous Variable?

Ans. Continuous variables are those variables that can have an infinite number of values but only in a specific range. For example, height is a continuous variable.


Q28. What is the Correlation?

Ans. Correlation is the ratio of covariance of two variables to a product of variance (of the variables). It takes a value between +1 and -1. An extreme value on both the side means they are strongly correlated with each other. A value of zero indicates a NIL correlation but not a non-dependence. You’ll understand this clearly in one of the following answers.
The most widely used correlation coefficient is the Pearson Coefficient. Here is the mathematical formula to derive the Pearson Coefficient.


Q29. What is Covariance?

Ans. Covariance is a measure of the joint variability of two random variables. It’s similar to variance, but where variance tells you how a single variable varies, covariance tells you how two variables vary together. The formula for covariance is:

Where,
x = the independent variable
y = the dependent variable
n = number of data points in the sample
x bar = the mean of the independent variable x
y bar = the mean of the dependent variable y
A positive covariance means the variables are positively related, while a negative covariance means the variables are inversely related


Q30. What is Multivariate Analysis?

Ans. Multivariate analysis is a process of comparing and analyzing the dependency of multiple variables over each other.
For example, we can perform a bivariate analysis of the combination of two continuous features and find a relationship between them.


Q31. What is Multivariate Regression?

Ans. Multivariate, as the word suggests, refers to ‘multiple dependent variables’. A regression model designed to deal with multiple dependent variables is called a multivariate regression model.
Consider the example – for a given set of details about a student’s interests, previous subject-wise score, etc, you want to predict the GPA for all the semesters (GPA1, GPA2, …. ). This problem statement can be addressed using multivariate regression since we have more than one dependent variable.


Q32. What is the Frequentist Statistics?

Ans. Frequentist Statistics tests whether an event (hypothesis) occurs or not. It calculates the probability of an event in the long run of the experiment (i.e the experiment is repeated under the same conditions to obtain the outcome).

Here, the sampling distributions of fixed size are taken. Then, the experiment is theoretically repeated an infinite number of times but practically done with a stopping intention. For example, I perform an experiment with a stopping intention in mind that I will stop the experiment when it is repeated 1000 times or I see a minimum of 300 heads in a coin toss. Read more here.


Q33. What is Descriptive Statistics?

Ans. Descriptive statistics are comprised of those values which explain the spread and central tendency of data. For example, mean is a way to represent the central tendency of the data, whereas IQR is a way to represent the spread of the data.


Q34.What is the Dependent Variable?

Ans. A dependent variable is what you measure and which is affected by the independent/input variable(s). It is called dependent because it “depends” on the independent variable. For example, let’s say we want to predict the smoking habits of people. Then the person smokes “yes” or “no” is the dependent variable.


Q35. What is the Confusion Matrix?

Ans. A confusion matrix is a table that is often used to describe the performance of a classification model. It is an N * N matrix, where N is the number of classes. We form a confusion matrix between the prediction of model classes Vs actual classes. The 2nd quadrant is called type II error or False Negatives, whereas 3rd quadrant is called type I error or False positives


Q36. What is Convex Function?

Ans. A real value function is called convex if the line segment between any two points on the graph of the function lies above or on the graph.

Convex functions play an important role in many areas of mathematics. They are especially important in the study of optimization problems where they are distinguished by a number of convenient properties.


Q37. What is the Cost Function?

Ans. The cost function is used to define and measure the error of the model. The cost function is given by:

Here,
h(x) is the prediction
y is the actual value
m is the number of rows in the training set
Let us understand it with an example:
So let’s say, you increase the size of a particular shop, where you predicted that the sales would be higher. But despite increasing the size, the sales in that shop did not increase that much. So the cost applied in increasing the size of the shop gave you negative results. So, we need to minimize these costs. Therefore we make use of cost function to minimize the loss.


Q38. What is Cross-Entropy?

Ans. In information theory, the cross-entropy between two probability distributions and over the same underlying set of events measures the average number of bits needed to identify an event drawn from the set, if a coding scheme is used that is optimized for an “unnatural” probability distribution, rather than the “true”. Cross entropy can be used to define the loss function in machine learning and optimization.


Q39. What is Cross-Validation?

Ans. Cross-Validation is a technique that involves reserving a particular sample of a dataset that is not used to train the model. Later, the model is tested on this sample to evaluate the performance. There are various methods of performing cross-validation such as:
1. Leave one out cross-validation (LOOCV)
2. k-fold cross-validation
3. Stratified k-fold cross-validation
4. Adversarial validation


Q40. What is Data Mining?

Ans. Data mining is a study of extracting useful information from structured/unstructured data taken from various sources. This is done usually for
Mining for frequent patterns
Mining for associations
Mining for correlations
Mining for clusters
Mining for predictive analysis
Data Mining is done for purposes like Market Analysis, determining customer purchase patterns, financial planning, fraud detection, etc


Q41. What is Data Science?

Ans. Data science is a combination of data analysis, algorithmic development, and technology in order to solve analytical problems. The main goal is the use of data to generate business value.

Q42. What is Data Transformation?

Ans. Data transformation is the process to convert data from one form to the other. This is usually done at a preprocessing step.
For instance, replacing a variable x by the square root of x

X
SQUARE_ROOT(X)
1
1
4
2
9
3


Q43.What is Dataframe?

Ans. DataFrame is a 2-dimensional labeled data structure with columns of potentially different types. You can think of it like a spreadsheet or SQL table, or a dict of Series objects. DataFrame accepts many different kinds of input:
1. Dict of 1D ndarrays, lists, dicts, or Series
2. 2-D numpy.ndarray
3. Structured or record ndarray
4. A series
5. Another DataFrame


Q44. What is Dataset?

Ans. A dataset (or data set) is a collection of data. A dataset is organized into some type of data structure. In a database, for example, a dataset might contain a collection of business data (names, salaries, contact information, sales figures, and so forth). Several characteristics define a dataset’s structure and properties. These include the number and types of the attributes or variables, and various statistical measures applicable to them, such as standard deviation and kurtosis.


Q45. What is Decision Boundary?

Ans. n a statistical-classification problem with two or more classes, a decision boundary or decision surface is a hypersurface that partitions the underlying vector space into two or more sets, one for each class. How well the classifier works depends upon how closely the input patterns to be classified resemble the decision boundary. In the example sketched below, the correspondence is very close, and one can anticipate excellent performance.

Here the lines separating each class are decision boundaries.


Q46. What is a Decision Tree?

Ans. The decision tree is a type of supervised learning algorithm (having a pre-defined target variable) that is mostly used in classification problems. It works for both categorical and continuous input & output variables. In this technique, we split the population (or sample) into two or more homogeneous sets (or sub-populations) based on the most significant splitter/differentiator in input variables.

Read more here.


Q47. What is Dimensionality Reduction?

Ans. Dimensionality Reduction is the process of reducing the number of random variables under consideration by obtaining a set of principal variables. Dimension Reduction refers to the process of converting a set of data having vast dimensions into data with lesser dimensions ensuring that it conveys similar information concisely. Some of the benefits of dimensionality reduction:
It helps in data compressing and reducing the storage space required
It fastens the time required for performing same computations
It takes care of multicollinearity that improves model performance. It removes redundant features
Reducing the dimensions of data to 2D or 3D may allow us to plot and visualize it precisely
It is helpful in noise removal also and as a result of that we can improve the performance of models


Q48. What is Dummy Variable?

Ans. Dummy Variable is another name for the Boolean variable. An example of dummy variable is that it takes value 0 or 1. 0 means value is true (i.e. age < 25) and 1 means value is false (i.e. age >= 25)


Q49.What is Deep Learning?

Ans. Deep Learning is associated with a machine learning algorithm (Artificial Neural Network, ANN) that uses the concept of the human brain to facilitate the modeling of arbitrary functions. ANN requires a vast amount of data and this algorithm is highly flexible when it comes to model multiple outputs simultaneously. To understand ANN in detail, read here.


Q50. What is Early Stopping?

Ans. Early stopping is a technique for avoiding overfitting when training a machine learning model with iterative methods. We set the early stopping in such a way that when the performance has stopped improving on the held-out validation set, the model training stops.
For example, in XGBoost, as you train more and more trees, you will overfit your training dataset. Early stopping enables you to specify a validation dataset and the number of iterations after which the algorithm should stop if the score on your validation dataset didn’t increase.


0
0

NoSQL Interview Questions and Answers for 2020


NoSQL Interview Questions and Answers

NoSQL Interview Questions and Answers, Are you looking for the list of top Rated NoSQL Interview Questions and Answers? Or the one who is casually looking for the Best Platform which is offering Best interview questions on NoSQL? Or the one who is carrying experience seeking the List of best NoSQL Interview Questions and Answers for experienced then stays with us for the most asked interview questions on NoSQL which are asked in the most common interviews.

We’re India’s Leading E-learning platform for Big Data offering Advanced Big Data certification Course to All our students who Enrolled with us. Get certified and learn the Course under 15+ Years of certified professionals of Our Big Data Training Institute in Bangalore from Today itself.


1) Write down the differences between NoSQL and RDBMS?

Ans Following is a list of the differences between NoSQL and RDBMS: –
In terms of data format, NoSQL does not follow any order for its data format. Whereas, RDBMS is more organized and structured when it comes to the format of its data.
When it comes to scalability, NoSQL is more very good and more scalable. Whereas, RDBMS is average and less scalable than NoSQL.
For querying of data, NoSQL is limited in terms of querying because there is no join clause present in NoSQL. Whereas, querying can be used in RDBMS as it uses the structured query language.
The difference in the storage mechanism of NoSQL and RDBMS, NoSQL uses key-value pairs, documents, column storage, etc. for storage. Whereas, RDBMS uses various tables for storing data and relationships.


2) What do you understand by NoSQL in databases?

The database management systems which are highly scalable and flexible are known as NoSQL databases. These databases allow us to store and process unstructured and semi-structured data which is not possible when we make use of the Relational database management system. NoSQL can be termed as a solution to all the conventional databases which were not able to handle the data seamlessly. It also gives an opportunity to the companies to store massive amounts of structured and unstructured data in real-time. In today’s time, big firms such as- Google, Facebook, Amazon, etc. use NoSQL for providing cloud-based services for storing data in real-time.


3) List some of the features of NoSQL?

Some of the features of NoSQL are listed below: –
Using NoSQL, we can store a large amount of structured, semi-structured, and unstructured data.
It supports agile sprint, quick iteration, and frequent code pushes.
It uses object-oriented programming which is frequent and is also easy to use.
It is more efficient. It has a scale-out architecture. It is cheap instead of being expensive. It has a monolithic architecture. It can be easily accessed.

Apache Spark SQL commands Tutorial & Programming Guide


4) What do you understand by ” Polyglot Persistence ” in NoSQL?

The term Polyglot Persistence was coined by Neal Ford in 2006 to express the idea that applications should be written in mixed languages. As we all know that different problems arise in all the applications. So, when an application is written using different languages, then those languages can be used to solve or tackle with different kinds of problems. This is known as polyglot persistence. Picking the right language for a particular problem can be more productive rather than trying to fit all the aspects of that problem into a single language. Hence, polyglot persistence is the term which is used to define this hybrid approach to persistence.


5) How does the NoSQL database management system budget memory?

The node which manages the data in the NoSQL database store is the replication node. It is also the main consumer of memory. The java heap and the cache size which are used by the replication node are the important factors in terms of performance. By default, these two things are calculated by NoSQL in terms of the amount of memory available to the storage node. Specification of the available memory for a storage node is recommended. The memory will be evenly divided between all the RN’s if the storage node hosts more than one replication node.


6) Explain the Oracle NoSQL database management system?

The NoSQL database management system is a distributed key-value database. It is designed so that it can provide highly reliable and scalable data. It can make the data storage available across all the configurable set of systems that function as storage nodes. In this database system, data is stored as key-value pairs. This data is written to a particular storage node. These databases provide a mechanism for the storage and retrieval of data which is composed in a way other than the tabular method which was used in relational databases.


7) What are the pros and cons of a graph database under NoSQL databases?

Following are the pros and cons of a graph database which is a type of NoSQL databases: –
Pros of using graph database:
These are tailor-made for networking applications. A social network is a good example of this.
They can also be perfect for an object-oriented programming system.
Cons of using graph database:
Since the degree of interconnection between nodes is high in the graph database, so it is not suitable for network partitioning.
Also, graph databases don’t scale out well in NoSQL databases.


8) List the different kinds of NoSQL data stores?

The variety of NoSQL data stores available which are widely distributed are categorized into four categories. They are: –
Key-value store– it is a simple data storage key system that uses keys to access different values.
Column family store– it is a sparse matrix system. It uses columns and rows as keys.
Graph store– it is used in case of relationships-intensive problems.
Document stores- it is used for storing hierarchical data structures directly in the database.


9) What is the CAP Theorem? How is it applicable to NoSQL systems?

The CAP theorem was proposed by Eric Brewer in early 2000. In this, three system attributes have been discussed within the distributed databases. That is-
Consistency- in this, all the nodes see the same data at the same time.
Availability- it gives us a guarantee that there will be a response for every request made to the system about whether it was successful or not.
Partition tolerance- it is the quality of the NoSQL database management system which states that the system will work even if a part of the system has failed or is not working.
A distributed database system might provide only 2 of the 3 above qualities.


10) What do you mean by eventual consistency in NoSQL stores?

Eventual consistency in NoSQL means that when all the service logics have been executed, the system is left in a consistent state. For achieving high availability, this concept is used in the distributed systems. It gives a guarantee that, if new updates are not made to a given data item, then eventually all accesses to that item will return the last updated value. In NoSQL, it is provided in terms of BASE and RDMS are also known as the ACID properties. Present NoSQL databases provide client applications with a guarantee of eventual consistency. Some NoSQL databases like- MongoDB and Cassandra are eventually consistent in some of the configurations.


11) What are the different types of NoSQL databases? Give some examples.

NoSQL database can be classified as 4 basic types:

1. Key-value store NoSQL database
2.Document store NoSQL database
3.Column store NoSQL database
4. Graph-based NoSQL database

There are many NoSQL databases. MongoDB, Cassandra, CouchDB, Hypertable, Redis, Riak, Neo4j, HBase, Couchbase, MemcacheDB, Voldemort, RevenDB, etc. are examples of NoSQL databases.


12) Is MongoDB better than other SQL databases? If yes then how?

MongoDB is better than other SQL databases because it allows a highly flexible and scalable document structure.

For example:
One data document in MongoDB can have five columns and the other one in the same collection can have ten columns.
MongoDB database is faster than SQL databases due to efficient indexing and storage techniques.


13) What type of DBMS is MongoDB?

MongoDB is a document-oriented DBMS


14) What is the difference between MongoDB and MySQL?

Although MongoDB and MySQL both are free and open-source databases, there is a lot of difference between them in terms of data representation, relationship, transaction, querying data, schema design and definition, performance speed, normalization and many more. To compare MySQL with MongoDB is like a comparison between Relational and Non-relational databases.


15) Why MongoDB is known as the best NoSQL database?

MongoDB is the best NoSQL database because it is:

1. Document Oriented
2. Rich Query language
3. High Performance
4. Highly Available
5. Easily Scalable


16) Does MongoDB support primary-key, foreign-key relationships?

No. By default, MongoDB doesn’t support the primary key-foreign key relationship.


17) Can you achieve primary key – foreign key relationships in MongoDB?

We can achieve the primary key-foreign key relationships by embedding one document inside another. For example, An address document can be embedded inside the customer documents.


18) Does MongoDB need a lot of RAM?

No. There is no need for a lot of RAM to run MongoDB. It can be run even on a small amount of RAM because it dynamically allocates and deallocates RAM according to the requirement of the processes.


19) Explain the structure of ObjectID in MongoDB.

ObjectID is a 12-byte BSON type. These are:

1. 4 bytes value representing seconds
2. 3-byte machine identifier
3. 2-byte process id
4.3 byte counter


20) Is it true that MongoDB uses BSON to represent document structure?

Yes.


21) What are Indexes in MongoDB?

In MongoDB, Indexes are used to execute queries efficiently. Without indexes, MongoDB must perform a collection scan, i.e. scan every document in a collection, to select those documents that match the query statement. If an appropriate index exists for a query, MongoDB can use the index to limit the number of documents it must inspect.


22) By default, which index is created by MongoDB for every collection?

By default, the_id collection is created for every collection by MongoDB.


23) What is a Namespace in MongoDB?

A namespace is a concatenation of the database name and the collection name. Collection, in which MongoDB stores BSON objects.

24) Can journaling features be used to perform safe hot backups?

Yes.


25) Why does Profiler use it in MongoDB?

MongoDB uses a database profiler to perform characteristics of each operation against the database. You can use a profiler to find queries and write operations


26) If you remove an object attribute, is it deleted from the database?

Yes, it is. Remove the attribute and then re-save() the object.


27) In which language MongoDB is written?

MongoDB is written and implemented in C++.


28) Does MongoDB need a lot of space for Random Access Memory (RAM)?

No. MongoDB can be run on a small free space of RAM.


29) What language you can use with MongoDB?

MongoDB client drivers support all the popular programming languages so there is no issue of language, you can use any language that you want.


30) Does MongoDB database have tables for storing records?

No. Instead of tables, MongoDB uses “Collections” to store data.


31) Do the MongoDB databases have a schema?

Yes. MongoDB databases have a dynamic schema. There is no need to define the structure to create collections.


32) What is the method to configure the cache size in MongoDB?

MongoDB’s cache is not configurable. Actually MongoDB uses all the free spaces on the system automatically by way of memory-mapped files.


33) How to do Transaction/locking in MongoDB?

MongoDB doesn’t use traditional locking or complex transaction with Rollback. MongoDB is designed to be lightweight, fast and predictable to its performance. It keeps transaction support simply to enhance performance.


34) Why 32-bit version of MongoDB is not preferred?

Because MongoDB uses memory-mapped files so when you run a 32-bit build of MongoDB, the total storage size of the server is 2 GB. But when you run a 64-bit build of MongoDB, this provides virtually unlimited storage size. So 64-bit is preferred over 32-bit.


35) Is it possible to remove old files in the moveChunk directory?

Yes, these files can be deleted once the operations are done because these files are made as backups during normal shard balancing operations. This is a manual cleanup process and necessary to free up space.


36) What will have to do if a shard is down or slow and you do a query?

If a shard is down and you even do the query, then your query will be returned with an error unless you set a partial query option. But if a shard is slow them Mongos will wait for them till response.


37)Explain the covered query in MongoDB.

A query is called a covered query if satisfies the following two conditions:
The fields used in the query are part of an index used in the query.
The fields returned in the results are in the same index.


38) What is the importance of covered queries?

Covered query makes the execution of the query faster because indexes are stored in RAM or sequentially located on disk. It makes the execution of the query faster.
Covered query makes the fields are covered in the index itself, MongoDB can match the query condition as well as return the result fields using the same index without looking inside the documents.


39) What is sharding in MongoDB?

In MongoDB, Sharding is a procedure of storing data records across multiple machines. It is a MongoDB approach to meet the demands of data growth. It creates a horizontal partition of data in a database or search engine. Each partition is referred to as a shard or database shard.


40) What is a replica set in MongoDB?

A replica can be specified as a group of mongo instances that host the same data set. In a replica set, one node is primary, and the other is secondary. All data is replicated from primary to secondary nodes.


41) What is the primary and secondary replica set in MongoDB?

In MongoDB, primary nodes are the nodes that can accept write. These are also known as master nodes. The replication in MongoDB is a single master so, only one node can accept write operations at a time.
Secondary nodes are known as slave nodes. These are read-only nodes that replicate from the primary.


42) By default, which replica sets are used to write data?

By default, MongoDB writes data only to the primary replica set.


43) What is CRUD in MongoDB?

MongoDB supports following CRUD operations:

1. Create
2. Read
3. Update
4. Delete


44) In which format MongoDB represents document structure?

MongoDB uses BSON to represent document structures.


45) What will happen when you remove a document from the database in MongoDB? Does MongoDB remove it from disk?

Yes. If you remove a document from the database, MongoDB will remove it from disk too.


46) Why are MongoDB data files large in size?

MongoDB doesn’t follow file system fragmentation and pre-allocates data files to reserve space while setting up the server. That’s why MongoDB data files are large in size.


47) What is a storage engine in MongoDB?

A storage engine is the part of a database that is used to manage how data is stored on disk.
For example, one storage engine might offer better performance for read-heavy workloads, and another might support a higher-throughput for write operations.


48) Which are the storage engines used by MongoDB?

MMAPv1 and WiredTiger are two storage engines used by MongoDB.


49) What is the usage of profiler in MongoDB?

A database profiler is used to collect data about MongoDB write operations, cursors, database commands on a running MongoDB instance. You can enable profiling on a per-database or per-instance basis.

The database profiler writes all the data it collects to the system. profile collection, which is a capped collection.


50) Is it possible to configure the cache size for MMAPv1 in MongoDB?

No. it is not possible to configure the cache size for MMAPv1 because MMAPv1 does not allow configuring the cache size.

0
0

Amazon ElastiCache

What is Amazon ElastiCache?


Amazon ElastiCache is a Caching-as-a-Service of Amazon Web Services. AWS simplifies setting up, managing, and scaling a distributed in-memory cache environment in the cloud platform. It provides a high-performance, scalable, & cost-effective caching solution. AWS removes the complexity associated with deploying & managing a distributed cache environment.

Caching is a technique to store frequently accessed information, HTML pages, images, videos and other static information in a temporary memory location on the server. Read-intensive web applications are the best use-case candidates for a cache service available in the AWS.

Introduction

In a web-driven world, catering to users’ requests in real-time is the goal of every website. Because performance & speed are required, a caching layer, like Amazon ElastiCache, is the first tool that every website employs in serving mostly static and frequently accessed data.

Why ElastiCache?

There are a number of caching servers used across applications, the most notable are memcached, Redis, and Varnish. There are various methods to implement caching using those technologies. However, with such a large number of industries moving their infrastructure to the cloud, many cloud vendors are also providing caching as a service.

Amazon ElastiCache is one of the popular web caching service which provides users with memcached or Redis-based caching that supports installation, configuration, HA, Caching failover and clustering.

How Amazon ElastiCache Works?

There are two engine software contains in Amazon ElastiCache wich explore given below:

memcached

memcached is an open-source, distributed, in-memory key-value store-caching system for small arbitrary data streams flowing from database calls, API calls, or page rendering. memcached has long been the first choice of caching technology for users and developers around the world.

Redis

Redis is a newer technology and often considered as a superset of memcached. That means Redis offers more and performs better than memcached. Redis scores over memcached in a few areas that we will discuss briefly.

  • Redis implements six fine-grained policies for purging old data, while memcached uses the LRU (Least Recently Used) algorithm.
  • Redis supports key names and values up to 512 MB, whereas memcached supports only 1 MB.
  • Redis uses a hashmap to store objects whereas memcached uses serialized strings.
  • Redis provides a persistence layer and supports complex types like hashes, lists (ordered collections, meant for queue), sets (unordered collections of non-repeating values), or sorted sets (ordered/ranked collections of non-repeating values).
  • Redis is used for built-in pub/sub, transactions (with optimistic locking), and Lua scripting.
  • Redis 3.0 supports clustering.

Amazon Elasticache Features

The Amazon ElastiCache has features to enhance reliability for critical production deployments, including:

  • Automatic detection & recovery from cache node failures.
  • Automatic failover (Multi-AZ’s) of a failed primary cluster to a read replica in Redis replication groups.
  • Flexible Availability Zone placement of nodes and clusters to avoid downtime.
  • Integration with other Amazon Web Services such as Amazon EC2, CloudWatch, CloudTrail, and Amazon SNS, to provide a secure, high-performance, managed in-memory caching solution.

Amazon ElastiCache provides two caching engine software, memcached and Redis. You can move your existing memcached or Redis caching implementation to an Amazon ElastiCache effortlessly. Simply change the memcached/Redis endpoints in your application.

Amazon ElastiCache

Before implementing Amazon ElastiCache, let’s get familiar with a few related Keypoints:

ElastiCache Node

Nodes are the smallest building block of Amazon ElastiCache service, which are typically network-attached RAMs (each having an independent DNS name & port).

ElastiCache Cluster

Clusters are logical collections of nodes. If your ElastiCache cluster is of memcached nodes, you can have nodes in multiple availability zones (AZs) to implement high-availability. In a case of a Redis cluster, the cluster is always a single node. You can have multiple replication groups across AZs.
A memcached cluster has multiple nodes whose cached data is horizontally partitioned among each node. Each of the nodes in the cluster is capable of reading and writing.

A Redis cluster has only one node, which is the master node. Redis clusters do not support data partitioning. Rather, there are up to five replication nodes in-replication groups which are read-only. They maintain copies from the master node which is the only writeable node.

ElastiCache memcached

Until now we have discussed both the caching engines, but I may seem biased towards Redis. So the question is, if Redis is all enough, then why doesn’t ElastiCache provide only Redis? There are a few good reasons for using memcached:

  • It is the simplest caching model.
  • It is helpful for people needing to run large nodes with multiple cores or threads.
  • It offers the ability to scale out/in, adding & removing nodes on-demand.
  • It handles partitioning data across multiple shards.
  • It handles cache objects, such as a database.
  • It may be necessary to support an existing memcached cluster.

Amazon ElastiCache

memcached cluster

Each node in the memcached cluster has its own endpoint. The cluster in memcached also has an endpoint called the configuration endpoint. If you enable Auto-Discovery and connect to the configuration endpoint, your application will automatically know each node endpoint – even after adding or removing nodes from the cluster. The latest version of memcached supported in  Amazon ElastiCache is 1.4.24.
In the memcached-based ElastiCache cluster, there can be a maximum of 20 nodes where data is horizontally partitioned. If you require more, you’ll have to request a limit increase via the ElastiCache Limit Increase Request form.

Apart from that, you can upgrade the memcached engine. Keep in mind that the memcached engine upgrade process is disruptive. The cached data is lost in any existing cluster when you upgrade.
Changing the number of nodes in a cluster is only possible for a memcached-based ElastiCache cluster. However, this operation requires careful design of the hashing technique you will use to map the keys across the nodes. One of the best techniques is to use a consistent hashing algorithm for keys.

Consistent hashing uses an algorithm such that whenever a node is added or removed from a cluster, the number of keys that must be moved is roughly 1 / n (where n is the new number of nodes).

1)Scaling from 1 to 2 nodes results in 1/2 (50 %) of the keys being move — the worst case.

2)Scaling from 9 to 10 nodes results in 1/10 (10 percent) of the keys being move. An unsuitable algorithm will result in heavy cache misses, thus increasing the load on a database & defeating the purpose of a caching layer.

ElastiCache Redis

We have discussed Redis & the replication groups earlier. All things considered, Redis will normally be the better selection:

  • Redis supports complex data types, such as strings, hashes, lists, & sets.
  • Redis sorts or ranks in-memory data-sets.
  • Redis provides persistence for your key store.
  • Redis replicates the cache data from the primary to one or more read replicas for read intensive applications.
  • Redis has automatic fail-over capabilities if the primary node fails.
  • Redis has publish & subscribe (pub/sub) capabilities where the client is inform of events on the server.
  • Redis has back-up and restore capabilities.

Currently, Amazon ElastiCache supports Redis 2.8.23 and lower. Redis-2.8.6 and higher is a significant step up because a Redis cluster on version 2.8.6 or higher will have Multi-AZ enabled. Upgrading is a non-disruptive process and the cache data is retain.
If you want to persist the cache data, Redis has something called Redis AOF (Append Only File). AOF file is useful in recovery scenarios. In the case of a node restart /service crash, Redis will replay the updates from an AOF file, thereby recovering the data lost. But AOF is not useful in the event of a hardware crash and AOF operations are slow.


AOF operations

A better way is to have a replication group with one or more read replicas in different availability zones & enable Multi-AZ instead of using AOF. Because there is no need for AOF in this scenario, ElastiCache disables AOF on Multi-AZ replication groups.

All the nodes in a replication group reside in the same region but in multiple availability zones (AZs). An ElastiCache replication group consists of a primary cluster & up to five read replicas. In the case of a primary cluster or availability zone failure, if your replication group is Multi-AZ enabled, ElastiCache will automatically detect the primary cluster’s failure, select a read replica cluster, & promote it to primary cluster so that you can resume writing to the new primary cluster as soon as the promotion is complete.
ElastiCache also propagates the DNS of the promoted replica so that, if your application is writing to the primary endpoint, no endpoint change will be required in your application. Make sure that your cache engine is Redis-2.8.6 or higher and have instance types higher than t1 and t2 nodes.

Redis cluster supports backup and restores processes. It is useful when you want to create a new cluster from existing cluster data.

Conclusion

Amazon ElastiCache offloads the management, monitoring, & operation of caching clusters in the cloud. It has detailed monitoring via Amazon CloudWatch without any extra cost overhead and is a pay-as-you-go service. I encourage you to use ElasticCache for your cloud-based web applications requiring split-second response times.

#Last but not least, always ask for help!


0
0

Getting Started With Amazon Redshift

Getting Started With Amazon Redshift


Getting Started With Amazon Redshift, Are you the one who is looking for the best platform which provides information about Getting Started With Amazon Redshift? Or the one who is looking forward to taking the advanced Certification Course from India’s Leading AWS Training institute? Then you’ve landed on the Right Path.

The Below mentioned Tutorial will help to Understand the detailed information about Getting Started With Amazon Redshift, so Just Follow All the Tutorials of India’s Leading Best AWS Training institute and Be a Pro AWS Developer.

Step 1: Set Up Prerequisites

Before you start to set up an Amazon Redshift cluster, make sure that you complete the following prerequisites in this section:

Sign Up for AWS

If you do not already have an AWS account, you must sign up for one. If you already have an account, you can skip this prerequisite and use your existing account.

Check Firewall Rules

If your client computer is behind a firewall, you need to configure an open port that you can use. This open port enables you to connect to the cluster from a SQL client tool and run queries during launching the redshift cluster, allow 5439 port in the firewall to access the cluster.

In this step to make a proper connection, you have to add Amazon Redshift Port 5439 which is by default and add it in inbound rule in the security group.

Step 2: Create an IAM Role

For any operation that accesses data on another AWS resource, your cluster requires permission to access the resource and the data on the resource on your behalf. The COPY command is used to load data from Amazon S3. You have to provide those permissions by using AWS Identity and Access Management (IAM). You do so either through an IAM role that is attached to your cluster or by providing the AWS access key for an IAM user that has the necessary permissions.

To best protect your sensitive data and to secure your AWS access credentials, we recommend creating an IAM role and attaching it to your cluster.

In this step, you create a new IAM role that enables Amazon Redshift to load data from the path of an object in an Amazon S3 bucket. In the next step, you have to attach the role to your cluster.

Steps to Create an IAM Role for Amazon Redshift

  1. Sign in to the AWS Management Console and open the IAM console at https://console.aws.amazon.com/iam/.
  2. In the navigation pane, choose Roles.
  3. Choose to Create role.

4. In the AWS Servicegroup, select Redshift

5. Under Select your use case, choose Redshift – Customizablethen click on Next: Permissions.

6. On the Attach permissions policies page, choose AmazonS3ReadOnlyAccess. You can leave the default setting for Set permissions boundary as it is. Then choose Next: Tags.

7. The Add tags page appears. You can optionally add tags. Choose Next: Review.

8. For Role name, enter a name for your role. For this tutorial, enter myRedshiftRole.

9. Review the information, and then select  Create Role.

10.Choose the role name of the role you just created.

11. Copy the Role ARNand save in secure place—this value is the Amazon Resource Name (ARN) for the role that you just created. You use that value when you use the COPY command to load data from Amazon S3.
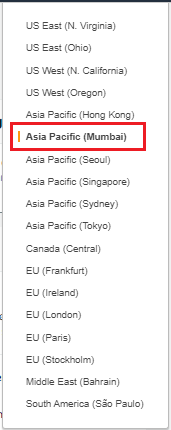
Once you create the new role, your next step is to attach it to your cluster. You can attach the role during launching a new cluster or you can attach it to an existing cluster. In the next step, you attach the role to a new cluster.

Step 3: Create a Sample Amazon Redshift Cluster

After completing prerequisites, you can launch your Amazon Redshift cluster.

Important

The cluster that you are about to launch is live. You incur the standard Amazon Redshift usage charges for the cluster until you delete it. If you complete the tutorial described herein one sitting and delete the cluster when you are finished the work, the total charges are minimal.

To launch an Amazon Redshift cluster

  1. Sign in to the AWS Management Console and open the Amazon Redshift console at https://console.aws.amazon.com/redshift/.

Important

If you use IAM user credentials, ensure that the IAM user has the necessary permissions to perform the cluster operations. In the main menu, select the AWS Region in which you want to create the cluster. For the purposes of this tutorial, select Asia Pacific (Mumbai Region).

  1. On the Amazon Redshift Dashboard, click on the Quick launch cluster.

The Amazon Redshift Dashboard looks similar to the following screenshot taken.

  1. On the Cluster specifications page, enter the following values and then choose Launch cluster:
    • Node type: Choose largely.
    • A number of compute nodes: Keep the default value of 1.
    • Cluster identifier: Enter the value redshift-cluster-1.
    • Master user name: Keep the default value of awsamol.
    • Master user password and Confirm password: Enter a password for the master user account.
    • Database port: Set the default value of 5439.
    • Available IAM roles: Choose myRedshiftRole.

The quick launch cluster automatically creates a default database named dev.

Note

Quick launch uses the default virtual private cloud (VPC) for your AWS Region. If a default VPC group doesn’t exist, the Quick launch returns an error. If you don’t have a default VPC group, you can use the standard Launch Cluster wizard to use a different VPC. A confirmation page appears and the cluster takes a few minutes to set up.  Click on the Close button to return to the list of clusters.

  1. On the Clusters page, choose the cluster that you just launched and review the Cluster Status Make sure that the Cluster Statusis available and the Database Health is healthy before you try to connect to the database later in this guide.

Getting Started With Amazon Redshift

5. The Clusters page, choose the cluster that you just launched, choose the Clusterbutton, then Modify cluster. Choose the VPC security groups to attach with this cluster, then choose Modify to make the association. Make sure that the Cluster Properties displays the VPC security groups you choose before continuing to the next step.

Step 4: Authorize Access to the Cluster

Note

A new console is available for Amazon Redshift. Choose either the New or the Original Console instructions based guide on the console that you are using.

In the earlier step, you launched your Amazon Redshift cluster. Before you can connect to the cluster, you need to configure a security group to authorize access to the cluster.

To configure the VPC security group (EC2-VPC platform)

  1. In the Amazon Redshift dashboard, in the navigation pane, choose Clusters.
  2. Choose redshift-cluster-1to to open it, and make sure that you are on the Configuration
  3. Under Cluster Properties, for VPC Security Groups, choose your security group.

4. After your security group opens in the Amazon EC2 console, choose the Inbound
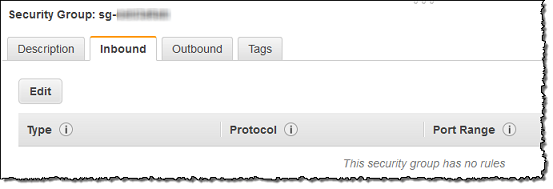
5. Choose EditAdd Rule, and set the following, then choose Save:

  • Select: Redshift
  • ProtocolTCP.
  • Port Range: Enter the same port number that you used when you launched the cluster. The default port number for Amazon Redshift is 5439, but your port might be different.
  • Source: Select Custom, then enter 0.0.0.0/0.

Important

Using source to anywhere 0.0.0.0/0 means is not recommended for anything other than demonstration purposes because it allows access from any computer on the internet. In a real environment, you create inbound rules based on your own network settings.

Step 5: Connect to the Cluster and Run Queries

To query databases hosted by your Amazon Redshift cluster, you have two methods:

  • Connect to your cluster and run queries to databases on the AWS Management Console with the query editor.

If you use the query editor, you don’t have to download and set up an SQL client application.

  • Connect to your cluster through an SQL client tool, such as SQL Workbench/J.

Topics

  1. Querying a Database by Using the Query Editor
  2. Querying a Database by Using a SQL Client

Querying a Database Using the Query Editor

Using the query editor is the easiest way to run queries on databases hosted by your Amazon Redshift cluster. After creating your cluster, you can immediately run queries using the console.

The following cluster node types support the query editor:

  • 8xlarge
  • large
  • 8xlarge
  • 8xlarge

Using the Amazon Redshift console query editor, you can do the following:

  • Run single SQL statement queries.
  • Download result sets as large as 100 MB to a comma-separated value (CSV) file.
  • Save the queries for reuse. You cannot save queries in the EU (Paris) Region or the Asia Pacific (Osaka-Local) Region.

Enabling Access to the Query Editor

To use the query editor, you need permission. To enable access, attach the AmazonRedshiftQueryEditor and AmazonRedshiftReadOnlyAccess policies for AWS Identity and Access Management (IAM) to the IAM user that you use to access your cluster.

If you have already created an IAM user to access the Amazon Redshift cluster, you can attach the AmazonRedshiftQueryEditor AmazonRedshiftReadOnlyAccess policies to that user. If you haven’t created an IAM user yet, create one and attach the policies to the IAM user.

To attach the required IAM policies for the Query Editor

  1. Sign in to the AWS Management Console and open the IAM console at https://console.aws.amazon.com/iam/.
  2. Choose Users.

3. Choose the IAM user that needs access to the Query Editor.

4. Click on Add permissions.

5. Click on   Attach existing policies directly.

6. For Policy names, choose AmazonRedshiftQueryEditorand AmazonRedshiftReadOnlyAccess.7. Click on   Next: Review.

8. Click on   Add permissions.

9. Download the csv file before closing the window contains Access key and Secret access key will use while accessing the resources via programmatic access.

Using the Query Editor

In the following demo, you use the query editor to perform the following tasks:

  • To run SQL commands.
  • View query execution details.
  • To save a query.
  • Download a query result set.

To use the query editor:

  1. Sign in to the AWS Management Console & open the Amazon Redshift console at https://console.aws.amazon.com/redshift/.
  2. In the navigation pane, click on   Query Editor.

3. In the Credentialsdialog box, enter the following values and then click on   Connect:

  • Cluster: Type your cluster name here redshift-cluster-1.
  • Databasedev.
  • Database userawsamol
  • Password: Enter the password that you specified when you launched the cluster.

4. For Schema, click on   information_schema to create a new table based on that schema.
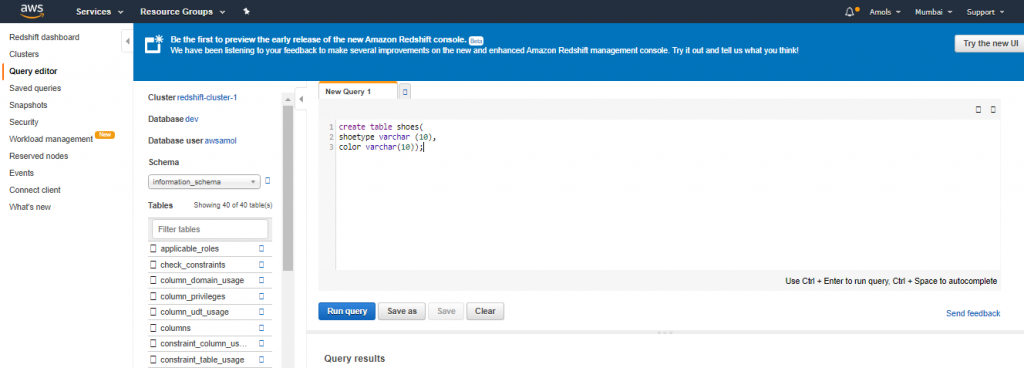
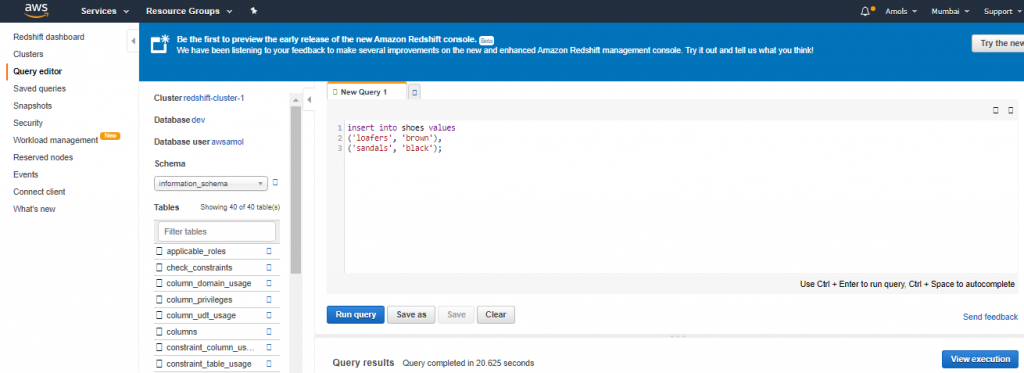
5. Enter the following in the Query Editor window & choose Run query to create a new table.

6. create table shoes(shoetype varchar (10), color varchar(10));

7. Choose Clear.

8. Enter the following command in the Query Editor window and choose Run query to add rows to the table.

9. insert into shoes values(‘loafers’, ‘brown’), (‘sandals’, ‘black’);

10. Choose Clear

11. Enter the following command in the Query Editor window & choose Run query to query the new table.

select * from shoes;

You should see the following results.

Step 6: Load Sample Data from Amazon S3 bucket

At this point, you have a database called dev & you are connected to it. Next, you create some tables in the database dev, upload data to the tables, and try a query. For your convenience, ensure the sample data to load is available in an Amazon S3 bucket.

Note

If you’re using a SQL client tool, check that your SQL client is connected to the cluster.

To load sample data into tables from s3 bucket:

  1. Create tables.

One-by-one copy and run the following create table command to create tables in the dev database.

create table users(   userid integer not null distkey sortkey,   username char(8),   firstname varchar(30),   lastname varchar(30),   city varchar(30),   state char(2),   email varchar(100),   phone char(14),   likesports boolean,   liketheatre boolean,   likeconcerts boolean,   likejazz boolean,   likeclassical boolean,   likeopera boolean,   likerock boolean,   likevegas boolean,   likebroadway boolean,   likemusicals boolean);

create table venue(   venueid smallint not null distkey sortkey,   venuename varchar(100),   venuecity varchar(30),   venuestate char(2),   venueseats integer);

create table category(   catid smallint not null distkey sortkey,   catgroup varchar(10),   catname varchar(10),   catdesc varchar(50));  create table date(   dateid smallint not null distkey sortkey,   caldate date not null,   day character(3) not null,   week smallint not null,   month character(5) not null,   qtr character(5) not null,   year smallint not null,   holiday boolean default(‘N’));

create table event(   eventid integer, not null dickey,   venueid smallint not null,   catid smallint not null,   dateid smallint not null sortkey,   eventname varchar(200),   starttime timestamp);

create table listing(   listid integer not null distkey,   sellerid integer not null,   eventid integer not null,   dateid smallint not null  sortkey,   numtickets smallint not null,   priceperticket decimal(8,2),   totalprice decimal(8,2),   listtime timestamp);

create table sales(   salesid integer not null,   listid integer not null distkey,   sellerid integer not null,   buyerid integer not null,   eventid integer not null,   dateid smallint not null sortkey,   qtysold smallint not null,   pricepaid decimal(8,2),   commission decimal(8,2),   saletime timestamp);

  1. Load the sample data from Amazon S3 by using the COPY

Note

If you have to load large datasets, then use COPY command into Amazon Redshift from Amazon S3 or DynamoDB

Download file tickitdb.zip that includes individual sample data files. Unzip and load the individual files to a ticket folder in your Amazon S3 bucket in your AWS Region. Edit the COPY commands in this tutorial to point to the files in your Amazon S3 bucket.

To upload data in Amazon S3:

  1. Ready your sample data
  2. Browse it from the local machine

Getting Started With Amazon Redshift

3. Click on upload

4. First, select the bucket in which you want to store data. Create a folder under which you have to store files called objects.

Getting Started With Amazon Redshift

5. Click on upload once you browse all the data.

6. Click on a bucket in which your data stored and check it.


To load sample data, you must provide authentication for your cluster to access Amazon S3 object on your behalf. You can provide either role-based authentication or a key-based authentication method. We recommend using a role-based authentication method.

For this step, you provide authentication by referencing the IAM role that you created and then attached to your cluster in earlier steps.

Note

If you don’t have proper permissions to access Amazon S3, you receive the following error message when running the COPY command: S3ServiceException: Access Denied.

The COPY commands include a placeholder for the Amazon Resource Name (ARN) for the IAM role, your bucket name, and an AWS Region, as shown in the following example.

copy users from ‘s3://<myBucket>/tickit/allusers_pipe.txt’ credentials ‘aws_iam_role=<iam-role-arn>‘ delimiter ‘|’ region ‘<aws-region>‘;

To authorize access using an IAM role, replace <iam-role-arn> in the CREDENTIALS parameter string with the role ARN for the IAM role that you created in Step 2 while creating the IAM Role.

Your COPY command looks similar to the following example.

copy users from ‘s3://<myBucket>/tickit/allusers_pipe.txt’ credentials ‘aws_iam_role=arn:aws:iam::123456789012:role/myRedshiftRole’ delimiter ‘|’ region ‘<aws-region>‘;

To load the sample data, replace <myBucket><iam-role-arn>, and <aws-region> in the following COPY commands with your values. Then run the commands one by one in your SQL client tool.

copy users from ‘s3://<myBucket>/tickit/allusers_pipe.txt’ credentials ‘aws_iam_role=<iam-role-arn>‘ delimiter ‘|’ region ‘<aws-region>‘;

copy venue from ‘s3://<myBucket>/tickit/venue_pipe.txt’ credentials ‘aws_iam_role=<iam-role-arn>‘ delimiter ‘|’ region ‘<aws-region>‘;

copy category from ‘s3://<myBucket>/tickit/category_pipe.txt’ credentials ‘aws_iam_role=<iam-role-arn>‘ delimiter ‘|’ region ‘<aws-region>‘;

copy date from ‘s3://<myBucket>/tickit/date2008_pipe.txt’ credentials ‘aws_iam_role=<iam-role-arn>‘ delimiter ‘|’ region ‘<aws-region>‘;

copy event from ‘s3://<myBucket>/tickit/allevents_pipe.txt’ credentials ‘aws_iam_role=<iam-role-arn>‘ delimiter ‘|’ timeformat ‘YYYY-MM-DD HH:MI:SS’ region ‘<aws-region>‘;

Getting Started With Amazon Redshift

copy listing from ‘s3://<myBucket>/tickit/listings_pipe.txt’ credentials ‘aws_iam_role=<iam-role-arn>‘ delimiter ‘|’ region ‘<aws-region>‘;

copy sales from ‘s3://<myBucket>/tickit/sales_tab.txt’credentials ‘aws_iam_role=<iam-role-arn>‘delimiter ‘\t’ timeformat ‘MM/DD/YYYY HH:MI:SS’ region ‘<aws-region>‘;

Now try the example queries.

 Get the definition for the sales table.

SELECT *        FROM pg_table_def    7.    WHERE tablename = ‘sales’;

Now  Find total sales on a given calendar date.

SELECT sum(qtysold)  FROM   sales, date  WHERE sales.dateid = date.dateid AND    caldate = ‘2008-01-05’;

Find top 10 buyers by quantity.

SELECT firstname, lastname, total_quantity      FROM (SELECT buyerid, sum(qtysold) total_quantity FROM sale            GROUP BY buyerid    ORDER BY total_quantity desc limit 10) Q, users WHERE Q.buyerid = userid     ORDER BY Q.total_quantity desc;

Getting Started With Amazon Redshift

Find events in the 99.9 percentile in terms of all time gross sales.

SELECT eventname, total_price      FROM  (SELECT eventid, total_price, ntile(1000) over(order by total_price desc) as percentile  FROM (SELECT eventid, sum(pricepaid) total_price FROM   sales GROUP BY eventid)) Q, event E WHERE Q.eventid = E.eventid AND percentile = 1 ORDER BY total_price desc;

Getting Started With Amazon Redshift

Run the command given below for example:

Select * from venue;

Getting Started With Amazon Redshift

Step 7: Find Additional Resources and Reset Your Cluster Environment

Once you have completed this tutorial, you can go to other Amazon Redshift resources to learn more about the concepts introduced in this guide. You can also reset your environment setup to the previous state. You might want to keep the sample cluster running if you want to try another tasks. However, remember that you continue to be charged for your cluster as long as it is running in your account. To avoid charges, revoke access to the cluster and delete it when you no longer need it.

To avoid charges, take snapshot of your cluster, and then delete it if no longer in use.

You can relaunch cluster it later from snapshot that you have taken.

Getting Started With Amazon Redshift

You can see Snapshot created in an image given below.

Getting Started With Amazon Redshift

#Last but not least, always ask for help!


0
0

Amazon Redshift

Amazon Redshift

Amazon Redshift

Amazon Redshift, you can learn About Amazon Redshift. Are you the one who is looking for the best platform which provides information about Amazon Redshift? Or the one who is looking forward to taking the advanced Certification Course from India’s Leading AWS Training institute? Then you’ve landed on the Right Path.

The Below mentioned Tutorial will help to Understand the detailed information about Amazon Redshift, so Just Follow All the Tutorials of India’s Leading Best AWS Training institute and Be a Pro AWS Developer.

“Amazon Redshift” is a fully managed, petabyte-scale data warehouse service in the cloud platform. You can start with just a few 100 GB of data and scale to a petabyte or more. This enables you to use your data to acquire new insights for your business & customers.

Introduction

Redshift is a pretty new technology launched in late 2012. If you want to create a data warehouse then you have to launch a set of nodes, called an Amazon Redshift cluster. After you configured your cluster, you can upload your data set and then perform data analysis queries. Regardless of the size of the data set, Amazon Redshift offers faster query performance using the same SQL-based tools and business intelligence applications that you use today.

  • OLAP: OLAP is an Online Analytics Processing System used by the Redshift.
  • OLAP transaction Example:

Suppose we want to calculate the Net profit for EMEA and Pacific for the Digital Radio Product. This requires to pull a large number of records. Following are the records required to calculate a Net Profit:

  1. Sum of Radios sold in EMEA.
  2. Sum of Radios sold in the Pacific.
  3. Cost of per radio in each region.
  4. The sales price of each radio
  5. Sales price – unit cost

The complex queries are required to fetch the records given by the above. Data Warehousing databases use different types of architecture both from a database perspective and an infrastructure layer.

Redshift Configuration

Redshift consists of two types of nodes:

Amazon Redshift

  1. Single node
  2. Multi-node

Single node: A single node stores up to 160 GB.

Multi-node: Multi-node is a node that consists of more than one node. It is of two types:

  • Leader Node

It manages client connections and receives queries. A leader node receives the queries from the client applications, parses the queries, and develops the execution plans. It coordinates with the parallel execution of these plans with the compute node and combines the intermediate results of all the nodes, and then return the final result to the client application.

  • Compute Node

A compute node executes the execution plans, and then intermediate results are sent to the leader node for aggregation before sending back to the client application. It can have up to 128 compute nodes.

 Amazon Redshift

fig. Amazon Redshift Architecture and its components

  1. Client applications employ either JDBC or ODBC to connect to Redshift Data Warehouse. Amazon Redshift is based on the PostgreSQL database, so most existing SQL client applications will work with only minimal changes.
  2. An Amazon Data Warehouse is structured as a cluster. A cluster is one or more compute nodes. A cluster having more than one compute node appoints one node as a leader node. This leader node is responsible for communication with client applications and to distribute compiled code to other compute nodes for parallel processing. Once compute nodes return filtered records, the leader node combines results to form the final aggregated result.
  3. Node Slices is partitions within compute nodes to provide parallelism.
  4. Amazon Redshift is specifically made for data warehouse processing on your AWS cloud platform
  5. It can scale and performs well on the constantly improving AWS platform
  6. It’s considered easier to just learn (e.g. for RDBMS DBA’s) than the learning curve for Hadoop
  7. There are no upfront fees and you pay as you go.

Why Amazon Redshift?

1. If you want to start querying large amounts of data quickly

Amazon Redshift is built for querying big data. Instead of running taxing queries against your application database (or your read replica), you can run fast queries by setting up a dedicated BI database for running such queries.

You can connect to it via PostgreSQL clients and easily run PostgreSQL queries.

2. If your current data warehousing solution is too expensive

Price is often a very important factor when deciding what solution to use. Amazon offers Redshift at a cheap rate as $1000 per TB/year, which is a lot cheaper than many other solutions. Amazon Redshift is also scalable, so you can scale up clusters to support your data up to the petabyte level. More importantly, the flexible pricing structure allows you to pay for only what you use.

3. If you don’t want to manage hardware

Just like other AWS cloud services, Amazon will handle all the hardware on their end. This means you don’t have to worry about managing hardware issues, which could be quite a hassle if you are running everything on-premise.

In addition, monitoring can be done easily from the AWS Management Console. You can also set up alerts using Amazon CloudWatch to be quickly notified of any potential issues.

4. If you want higher performance for your aggregation queries

Amazon Redshift is a columnar database. As a columnar database, it is particularly good at queries that involve a lot of aggregations per column. This is especially true when you’re querying through the large amounts of data to gain insights against your data, such as when performing historical data analysis, or even when creating metrics for your recent application data.

5. If you want an easy way to move data to your data warehouse

There are often difficulties with continuously moving data to a data warehouse. However, because Redshift is within AWS, there are a few efficient ways to move the data over to your Redshift cluster. You can move data into Redshift from S3 using a COPY command or you can use Amazon’s Data Pipeline to start moving data to Redshift from other AWS sources. Additionally, you can try third-party vendors like our FlyData Sync to continually keep your MySQL instances synced with your Redshift cluster.

AWS Redshift Features

Here are the Amazon Redshift top features list:

  1. Optimizing the Data Warehousing
  2. Petabyte Scale
  3. Automated Backups
  4. Restore the data fast
  5. Network Isolation

1.Optimizing the Data Warehousing

Mostly the Amazon Redshift will make use of a variety of innovations to obtain the high quality of results on the datasets that range from hundred GB’s to an Exabyte and even more than that too. Whereas coming to the Petabyte sector, the local data use the columnar storage to compress and reduce the data according to the need to perform the queries.

2. Petabyte Scale

By using just a few clicks in the console and Simple API call, you can avail to change all the types of nodes that contain in the What is Data Warehouse by scaling the Petabyte data by compressing the user data.

3. Automated Backups

The data in the Amazon can be automatically and continuously set to get the backups directly from the new data to Amazon S3. Introduction by using this Amazon Redshift. It can be able to store all the snapshots of you for a particular period from 1-35 days approximately. You are also eligible to take your snapshots at any time by retaining the deleted data.

4. Restore the data fast

The Amazon Redshift is also used for any system or the user snapshot to restore the entire cluster quickly through AWS management consoles and API’s. The cluster is available according to the system metadata to restore all the running queries that spooled down the background.

5. Network Isolation

The network Isolation at Amazon Redshift enables the users to configure all the firewall rules, which can also give and network control access to your data warehouse cluster. With this, you can even process inside the Amazon VPC, particularly to isolate the data warehouse and connect automatically to the existed IT infrastructure.

Benefits of Amazon Redshift

The following are some of the major benefits of using the Amazon Redshift:

  1. Fast Performance
  2. Inexpensive
  3. Extensible
  4. Scalable
  5. Simple to Use
  6. Compatible
  7. Secured

1. Fast Performance:

The Amazon Redshift can deliver fast query performance with the help of column storage technology across the various nodes. The data load can speed up all the scales with the cluster size along with the various integrations like Amazon DB, Amazon EMR, Amazon S3, etc.

2. Inexpensive:

In this AWS Redshift, you can pay the amount on what you use for. You can also get an unlimited number of clients along with the unmetered analytics for your 1 TB data at just $1000/ years and 1/10th of the cost for the remaining traditional warehouse data solutions. To reduce the cost between the $250-$333 per year, the clients are compressing the data plan according to it.

3. Extensible:

The Redshift spectrum at AWS will enable the users to run the queries concerning the data in the Amazon S3 that can be stored on local disks of Amazon Redshift. You can also make use of the SQL syntax as well as the BI tools to store the highly structured and frequent access data to keep all the amounts of data safely.

4. Scalable to Use:

The Amazon Redshift is very easy to resize the ups and downs of the cluster according to your performances and capacity, which needs a few clicks to console with a simple API call.

5. Simple:

The Amazon Redshift will allow the users to automate all the administrative tasks to scale, monitor and manage all the data that consists of a warehouse. BY handling this process, you can consume less time and free up to focus as well as on the data and your business.

6. Compatible:

The compatible model at Amazon Redshift will support all the standard SQL by providing the custom ODBC and JDBC drivers to console the use of SQL customers.

7. Secured:

The security at Amazon Redshift is the built-in option, which is specifically designed to encrypt the data in transit and rest at the clusters of Amazon VPC and also helps to manage the keys by using the AWS KMS and HSM.

How to get started with Amazon Redshift?

Let’s discuss the key steps to start with AWS Redshift:

Step1: If you are not having an AWS account, sign up for one. If you already have an account, use the existing AWS account. 

Step2: In this step, create an IAM role to access data from Amazon S3 buckets. In the next step, you will attach a role to your cluster. 

Step3: Now launch an Amazon Redshift cluster.

Step4: To connect with the cluster, you need to configure the security settings to authorized the cluster access. 

Step5: Connect to the cluster and run the queries on the AWS management console with the query editor.

Step6: Now create tables in the database and upload the sample data from Amazon S3 buckets. 

Step7: Finally, find additional resources and reset your environment according to your requirements.

Conclusion

“Amazon Redshift” is a dominant technology in the modern analytics toolkit, which allows business users to analyze datasets and run into billions of rows with agility and speed. Other data analytics tools like Tableau connects to Amazon Redshift for advanced speed, scalability, and flexibility, accelerating the results from days to seconds. With AWS Redshift potential, the user can analyze vast amounts of data at the speed of thought and get into action immediately.

#Last but not least, always ask for help!

0
0

Quick Support

image image