Outliers in Machine Learning
Outliers in Machine Learning
Outliers in Machine Learning, Are you the one who is looking forward to knowing Outlier detection introduction in Machine Learning? Or the one who is looking forward to knowing outlier detection techniques in Machine Learning and the effects of outliers in data or Are you dreaming to become to certified Pro Machine Learning Engineer or Data Scientist, then stop just dreaming, get your Data Science certification course with Machine Learning from India’s Leading Data Science training institute.
Outliers are data points that are distant from other similar points due to variability in the measurement. Outliers should be excluded from the data set but detecting of those outliers is very difficult which is not always possible. The below blog clearly explains your effects of outliers in data and how to identify outliers in data. Do you want to know outlier detection introduction, So follow the below-mentioned outliers in the machine learning tutorial from Prwatech and take advanced Data Science training with Machine Learning like a pro from today itself under 10+ Years of hands-on experienced Professionals.
Outlier Detection Introduction
A data point that lies outside the overall distribution of the dataset is called an outlier of the data. An outlier is an observation point that is distant from other observations statistically, i.e. Outlier is separate or different from a point or set of points in the group. So in short we can call it as ‘odd man out’ from the dataset
Effects of Outliers in data:
Due to variability in data or experimental errors like mistakes in data collection, recording, and entry, the datasets contain outliers. In the case of statistical analysis, it can cause major problems like :
Data skewing
Errors in the mean of the data set.
Errors in the standard deviation of the data set.
How to Identify Outliers in Data?
To identify outliers effectively, we can employ two approaches within the framework.
DIFFERENT TYPES OF OUTLIERS:
In various datasets, we encounter two distinct types of outliers that require specific handling.
- Uni variate (one variable outlier): This involves analyzing outliers within a single variable.
- Multivariate outliers (Two or more variable outliers): This pertains to scenarios where we assess outliers across multiple variables, particularly when one of them is categorical.
How to Handle Outliers in Data?
One way to tackle outliers is through visualization tools.
Finding outliers with visualization tools
Using scatter plots:
A scatter plot serves as a mathematical representation illustrating values for typically two variables within a dataset. It utilizes Cartesian coordinates, with data depicted as a collection of points. Each point on the plot represents the value of one variable on the horizontal axis and another variable on the vertical axis.
To begin, we can load the Boston file from sklearn.
import pandas as pd
import numpy as np
from sklearn.datasets import load_boston
boston = load_boston()
x = boston.data
y = boston.target
columns = boston.feature_names
#create the data frame with x and y
df = pd.DataFrame(boston.data)
df.columns = columns
df.head()
To check the scatter plot, we can access variables named ‘INDUS’ and ‘TAX’ from Boston data.
import matplotlib.pyplot as plt
%matplotlib inline
fig, testplot = plt.subplots(figsize=(16,8))
testplot.scatter(df[‘INDUS’], df[‘TAX’])
testplot.set_xlabel(‘Proportion of non-retail business acres per town’)
testplot.set_ylabel(‘Full-value property-tax rate’)
plt.show()
It will give a graphical view as,
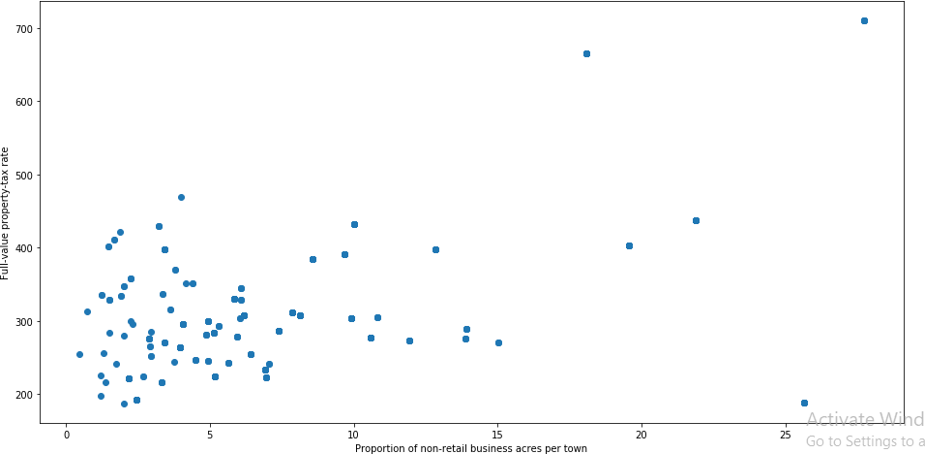
From the above plot, it is observed clearly that the points having the same features are collectively placed at the left bottom and points which are outliers are placed far away from the group.
Using Box Plots:
A box plot is a method for representing collections of numerical data through their quartiles. Outliers may be plotted as individual points in this graphical representation. So from this, we can find out the separately placed points in the box plot as outliers.
First load the boston file from sklearn:
import pandas as pd
import numpy as np
from sklearn.datasets import load_boston
boston = load_boston()
x = boston.data
y = boston.target
columns = boston.feature_names
#create the data frame with x and y
df = pd.DataFrame(boston.data)
df.columns = columns
df.head()
Now we will plot the box plot using ‘box plot’
import seaborn as sns
sns.boxplot(x=df[‘DIS’])
We get the box plot as:
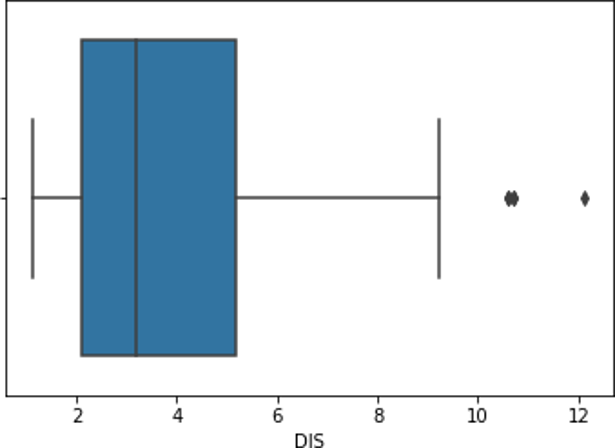
As shown in the box plot the points which are outliers are placed or plotted separate points. The univariate outlier is analyzed here as a single variable column called ‘DIS’ is only taken into account to check the outlier. But we can do multivariate outlier analysis also in case of any categorical value. Here continuous variables can be analyzed with any categorical value.
Finding Outliers with Mathematical Function
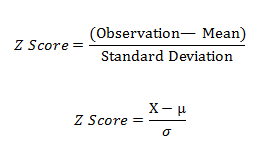
Using Z-score:
Z-score is used to describe any data point by finding their relationship with the Standard Deviation of the dataset and the Mean of the group of data points. Z-score is identifying the normal distribution of data where the mean is 0 and the standard deviation is 1.
from scipy import stats
import numpy as np
z = np.abs(stats.zscore(data))
print(z)
threshold=3
print(np.where(z>3))
Correcting and removing the outliers using z-score:
data = data[(z < 3).all(axis=1)]
Using Interquartile range (IQR):
The interquartile range (IQR) is a quantity to measure of dispersion, like standard deviation or variance, based on the division of a data set into quartiles.
Q1 is the central value in the first half of the data set.
Q2 is the median value in the dataset.
Q3 is the central value in the second half of the data set.
The interquartile range is nothing but the difference between Q3 and Q1. We will find outliers in the same data using IQR.
Q1 = df.quantile(0.25)
Q3 = df.quantile(0.75)
IQR = Q3 – Q1
print(IQR)
It will show the result of having a list that contains IQR for each row. Now to find out the outliers we can write.
print(df < (Q1 – 1.5 * IQR)) |(df > (Q3 + 1.5 * IQR))
The result will give output in form of True or False values. True means the values which fall after and before the third and first quartile.
df_clean = df[~((df< (Q1 – 1.5 * IQR)) |(df > (Q3 + 1.5 * IQR))).any(axis=1)]
df_clean will give the dataset excluding outliers.
We hope you understand outliers in Machine Learning concepts and outlier detection techniques, how to handle outliers in data. Get success in your career as a Data Scientist/ Machine Learning Engineer by being a part of the Prwatech, India’s leading Data Science training institute in Bangalore.


