Regression Analysis Tutorial with Examples
Regression Analysis Tutorial with Examples
Regression Analysis Tutorial, Are you the one who is looking forward to knowing the regression analysis tutorial with Examples? Or the one who is looking forward to knowing the classification of regression analysis in Machine Learning and need of requirement analysis or Are you dreaming to become to certified Pro Machine Learning Engineer or Data Scientist, then stop just dreaming, get your Data Science certification course with Machine Learning from India’s Leading Data Science training institute.
Regression Analysis explains the relation between independent and dependent variables mathematically. When you specify values for independent variables, then Regression allows predicting mean values of dependent variables. In this blog, we will learn regression analysis definition, classification of regression analysis with examples, and need of regression analysis, introduction to linear regression analysis, types of linear regression analysis.
Do you want to know the classification of regression analysis in machine learning, So follow the below-mentioned Decision Regression analysis Tutorial with examples from Prwatech and take advanced Data Science training with Machine Learning like a pro from today itself under 10+ Years of hands-on experienced Professionals.
Regression Analysis Definition:
Regression means building a functional relationship or model between (dependant and independent) variables. In datasets of several fields usually, some circumstances of interest having a number of observations are taken into account. Following the assumption that at least one of the features depends on the others, a relationship among them can be established.
Need for Requirement Analysis
Regression is helpful in relating particular variables. For example, one may use it to identify if and to what extent the weight and gender impact salaries.
Regression is also helpful when you need to predict a response using a new set of predictors. For example, you could try to predict water consumption of a household for the next week given the outdoor temperature, time of day, and the number of members in that household. It is a widely used statistical technique for the economy, weather forecast, banking sectors, and so on.
What we see in Regression Analysis
Is there any relationship between the variables of the dataset?
How strong the relevance is?
Whether the variables are linearly or nonlinearly related?
How accurately can we estimate the relationship between variables?
How better will be the model for prediction purpose?
Classification of Regression Analysis
Based on the analysis regression technique can be classified as follows:
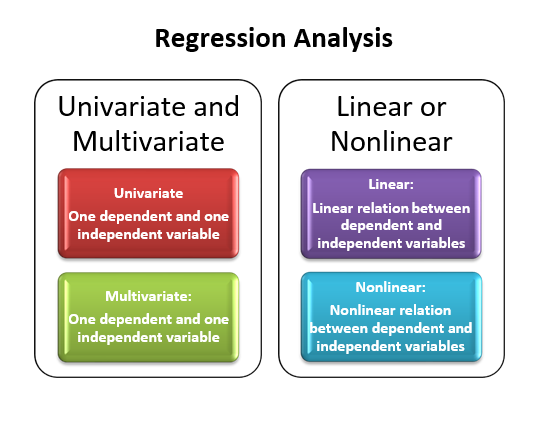
The most used type is linear regression which is next categorized as simple linear regression and multi-linear regression.
Simple Linear Regression: Simple linear regression is an approach towards predicting a response using a single feature.
Multi Linear Regression: Multiple linear regressions are one of the most common forms of linear regression analysis. In a prediction analysis, multiple linear regression is used to explain the relationship between one continuous dependent variable and two or more independent variables. The independent variables can be continuous or categorical.
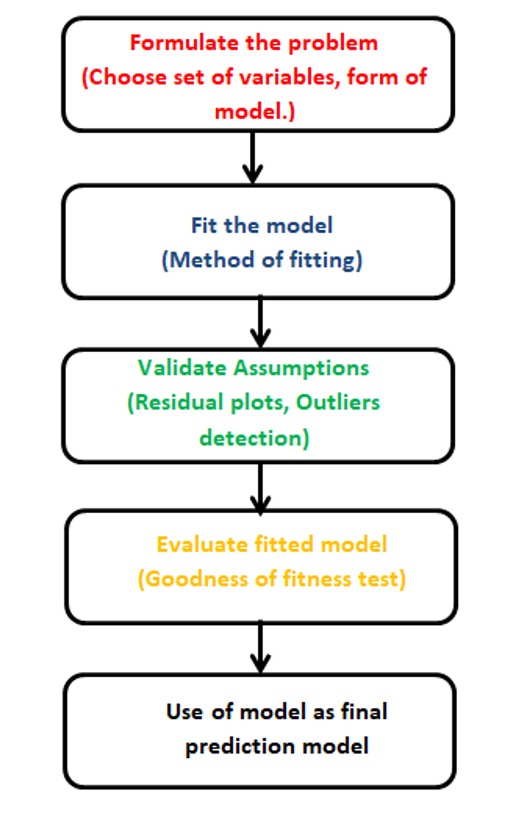
Regression is an iterative process which can be elaborated as follows:
Introduction to Linear Regression Analysis
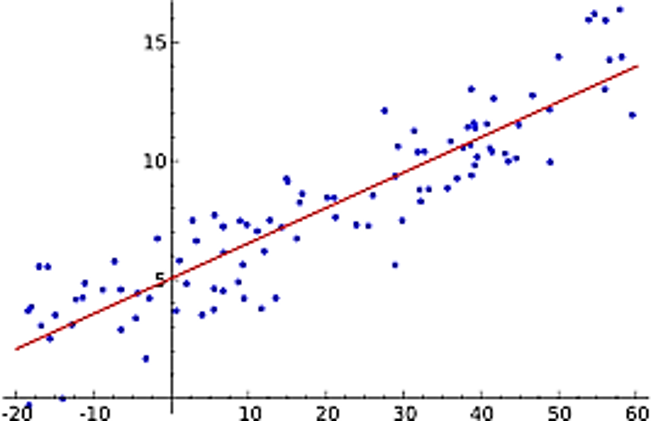
Linear regression is a category of regression where one variable changes linearly according to another variable. It may be a positive linear regression or negative linear regression. It simply states the equation:
y= mx+c
Where y= Dependent Variable, x = Independent variable
m= Slope or the coefficient, c= Intercept
It indicates a single independent and single dependent variable.
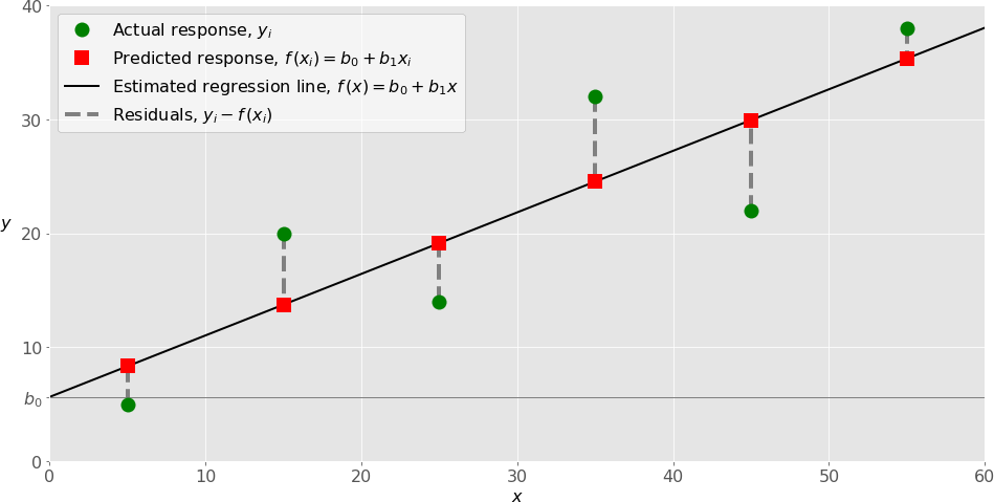
Means dependent variable changes according to the independent variable with coefficient ‘m’ and constant ‘c’. Here ‘m’ may be positive or negative, and accordingly, we get either positive or negative linear regression. In the linear regression analysis, we try to find the best-fit line such that the difference between actual and predicted value can be minimum.
Types of Linear Regression Analysis
Linear regression has two types. Simple linear regression and Multiple linear regression depending on the number of independent variables. Let’s see more about these types.
Simple Linear Regression with Example
In simple linear regression only one independent and one dependent variable preset.
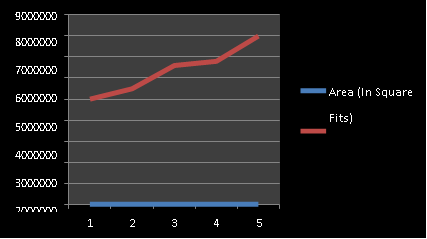
Example: The following table shows prices according to the area. The cost increases as the area (square feet) increase. It is an example of positive linear regression.
| Area (In Square Fits) | Price(in Rs) |
| 2550 | 5000000 |
| 3200 | 5500000 |
| 3500 | 6600000 |
| 3800 | 6800000 |
| 4000 | 7500000 |
Herewith reference to table we have to achieve the maximum accuracy on predicting the price based on area.
The following steps should be followed:
Import libraries
Read the file. Assign one variable to store it:
df=pd.read_excel(“Your file_path”)
df
Assign variable names for the independent and dependent fields. Generally, we assign ‘x’ to independent variables and ‘y’ to the dependent variable. Here Area is ‘x’ and the price changes accordingly so it’s ‘y’
Y=df.drop([‘Area (In Square Fits)’],axis=1)
X=df.drop([‘Price(in Rs)’],axis=1)
Import sklearn for linear regression and mean squared error.
from sklearn.linear_model import LinearRegression
from sklearn.metrics importmean_squared_error
Implement the regression function on the given dataset
reg=LinearRegression() reg=reg.fit(X,Y)
Predict output for independent variable X.
Y_pred=reg.predict(X)
Check accuracy as
acc_score=reg.score(X,Y) print(acc_score)
Now if we have to predict the price for area 4500 then we have to put the area in the prediction model as input:
reg.predict([[4500]])
While calculating the score we consider the R2 value as the coefficient of determination, which is a measure of variability in output variable (Y) defined by input variable (X). This value is between 0 and 1.Value 0 indicates a poor fit, value near to 1 indicates a good fit.
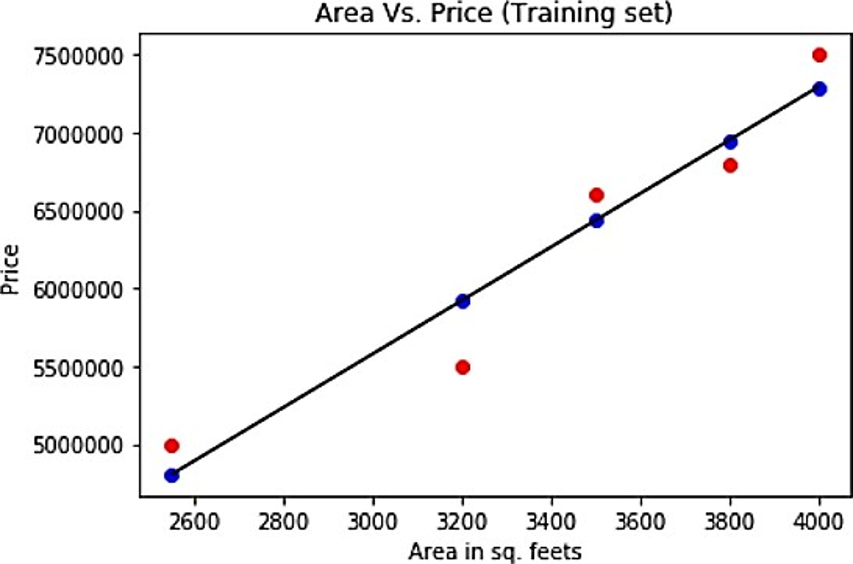
To see the graphical form of actual and predicted values we can write code as:
plt.scatter(X, Y, color = ‘red’) plt.
plot(X,Y_pred,’bo’,X,Y_pred,’k’)
plt.title(‘Area Vs. Price (Training set)’)
plt.xlabel(‘Area in sq. feets’)
plt.ylabel(‘Price’)
plt.show()
Result:
The graph shows the line of best fit with predicted values and actual values of ‘y’ i.e. price.
Multiple Linear Regression with Example:
y= m1x1+m2x2+……………. +mnxn+c
Where y= Dependent Variable,x1,x2,….. xn= Independent variable
m1,m2,… ,mn = coefficients, c =Intercept
It indicates single dependent and multiple or more than one dependent variable. In simple linear regression only one independent and one dependent variable preset.
Example: The following table shows price depending on different factors like area, number of bedrooms, age of the flat, which are independent variables for the price? To build the model based on multiple linear regressions we have to follow the steps as:
The following steps should be followed:
Import Python libraries
Read the file. Assign one variable to store it:
df=pd.read_excel(“Your file_path”)
df
Assign variable names for the independent and dependent fields. Generally, we assign ‘x’ to independent variables and ‘y’ to the dependent variable. Here Area is ‘x’ and the price changes accordingly so it’s ‘y’.
X=df.drop([‘Price(in Rs)’],axis=1) Y=df[‘Area (In Square Fits)’]
Import sklearn for linear regression and mean squared error.
from sklearn.linear_model import LinearRegression from sklearn.metrics import mean_squared_error
Implement the regression function on the given dataset
Reg = LinearRegression()
reg=reg.fit(X,Y)
Predict output for independent variable X.
Y_pred=reg.predict(X)
Check accuracy as
acc_score=reg.score(X,Y) print(acc_score)
Now if we have to predict the price for area 5000, bedroom -2 then we have to put the area in the prediction model as input:
reg.predict([[5000,2,2]])
We hope you understand the regression analysis tutorial with examples concepts. Get success in your career as a Data Scientist/ Machine Learning Engineer by being a part of the Prwatech, India’s leading Data Science training institute in Bangalore.


