Working with Data Studio
Building a Data Studio Report From a BigQuery Table
Data Studio is Google’s free reporting and dashboard tool. It connects directly to a data source, BigQuery, Google Sheets, Google Ads, and dozens of others, and turns whatever is in there into charts, tables, and scorecards you can arrange on a page and share with a link, the same way you would share a Google Doc.
Connecting it to BigQuery specifically matters because the report stays live. Data Studio queries the table directly each time the report loads, so a chart built today keeps reflecting whatever the underlying table looks like next week or next month, without anyone needing to re-export a file or rebuild the report by hand. That is the main reason teams reach for this pairing over something like a static spreadsheet export, the dashboard updates itself.
This walks through the whole path end to end, starting a report, connecting it to a BigQuery table, working around the one common snag with public datasets, adding a chart, and sharing the finished result.
Step by Step Process of Building a Data Studio Report from a BigQuery Table
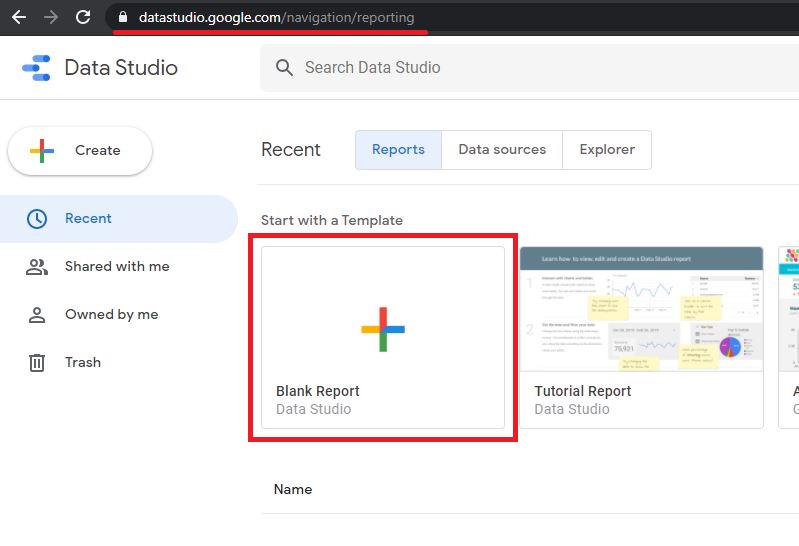
Step One: Start a Blank Report
Click on the below link to open data studio.
Click on Blank report
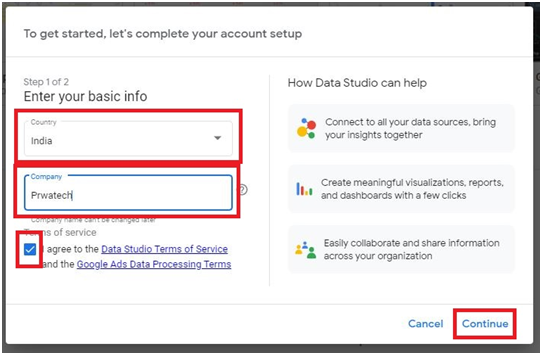
Step Two: Complete the First Time Setup
Enter your country and company name, tick to agree to the terms of service, then click Continue.
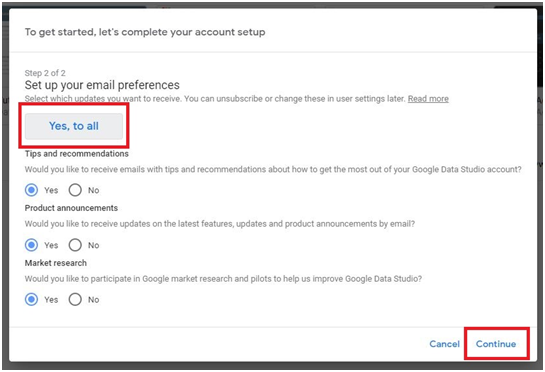
Click Yes to all, then Continue.
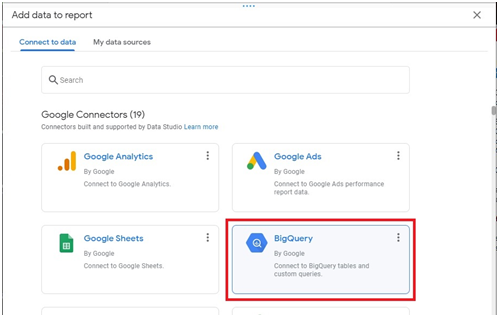
Step Three: Connect to BigQuery
Select BigQuery as your data source.
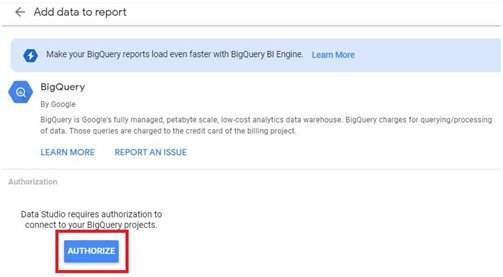
Click Authorize.
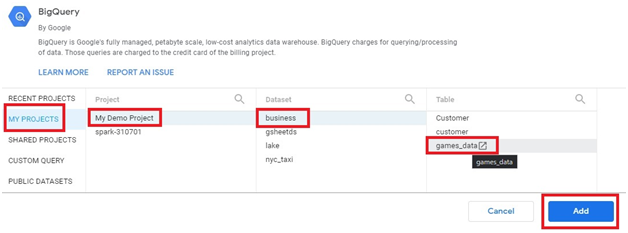
Choose the Project > Dataset > Table.
Click Add
If a Public Dataset Table Does Not Appear
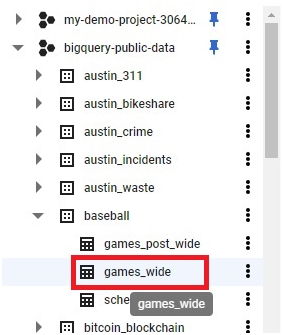
Public datasets sometimes will not show up directly in this picker. If that happens, copy the table into your own project’s BigQuery dataset first, then connect to that copy instead.
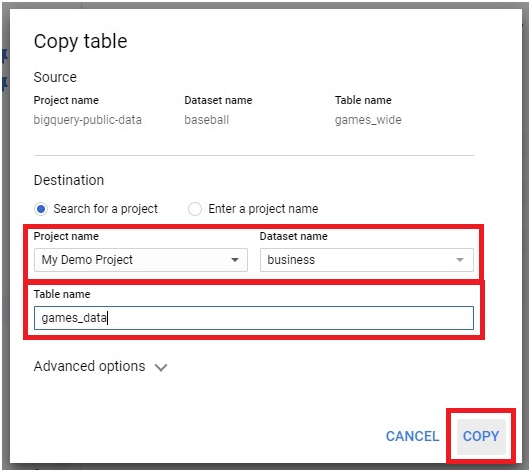
Open the table in BigQuery.
Click Copy table.
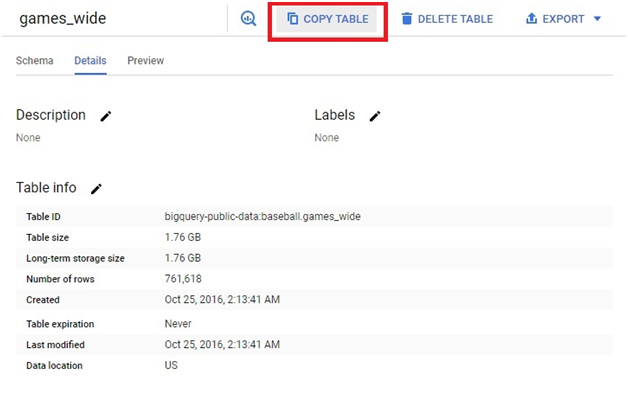
Give the Project name & dataset name.
Give the table name and press copy.The table will be copied into out project dataset.
Step Four: Add the Table to Your Report
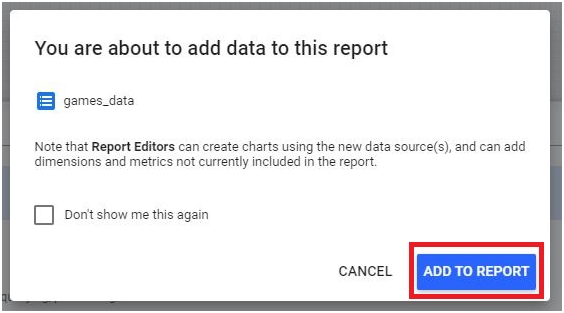
Click Add to Report.
Step Five: Add a Chart
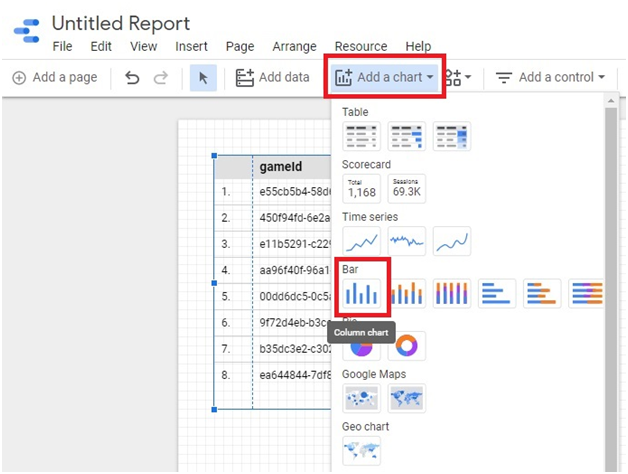
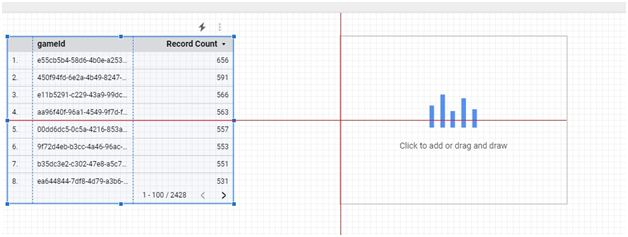
Click Add a Chart, then choose the chart type you want.
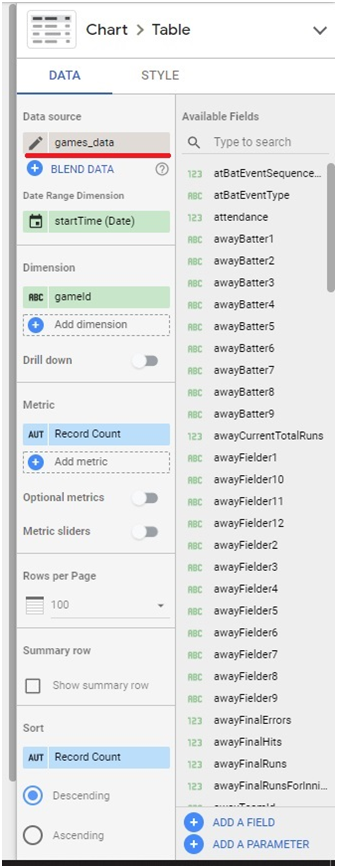
Click anywhere on the canvas to place it. You can move and resize it afterward.
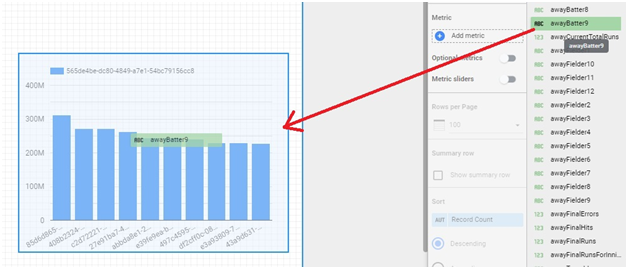
Drag a field from the right side onto the chart, and it builds itself automatically from that field.
Step Six: Finish and Share the Report
Data Studio’s editing tools feel close to Google Sheets and Google Docs, so most of what you already know from those carries over directly here.
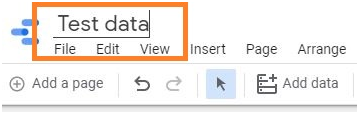
Change the report’s name at the top.
Data Studio is more similar to google sheets. All the fuctionalities we can get in google sheets and google docs, we will get in here.
change the name of report
Add more charts, controls, and other elements as needed.

Click Share to send the report to others.

Common Mistakes to Avoid
- Calling the tool Looker Studio in anything you publish today. That was accurate between October 2022 and April 2026, but the current name, in Google’s own product and documentation, is Data Studio again.
- Assuming a missing public dataset table means something is broken. It is a known limitation of the picker, and copying the table into your own project’s dataset first resolves it.
- Building a chart before checking which fields you actually need. Drag the right field onto the canvas first, since a chart type that does not fit the data usually needs to be swapped out anyway.
That covers connecting BigQuery to Data Studio and building a shareable report from it. To go further, explore Prwatech’s Google Cloud training program, which includes placement assistance.