Data Cleaning in Machine Learning
Data Cleaning in Machine Learning
Imagine a shop owner who keeps sales in a notebook. One page says 12 kg of rice, another says twelve, a third says 12 kilos, and one line just says na. Before anyone can add up the week’s sales, someone has to read every line and make it consistent. That tidying is data cleaning, and it is the least glamorous and most important part of machine learning.
A model can only learn from what it is given. If the data has duplicates, blanks, typing errors, and the same city spelled three ways, the model learns the mess. Practitioners often say that most of a project goes into preparing data, and your own experience will soon show why. Good cleaning rarely makes a headline, yet it often raises accuracy more than switching to a fancier algorithm.
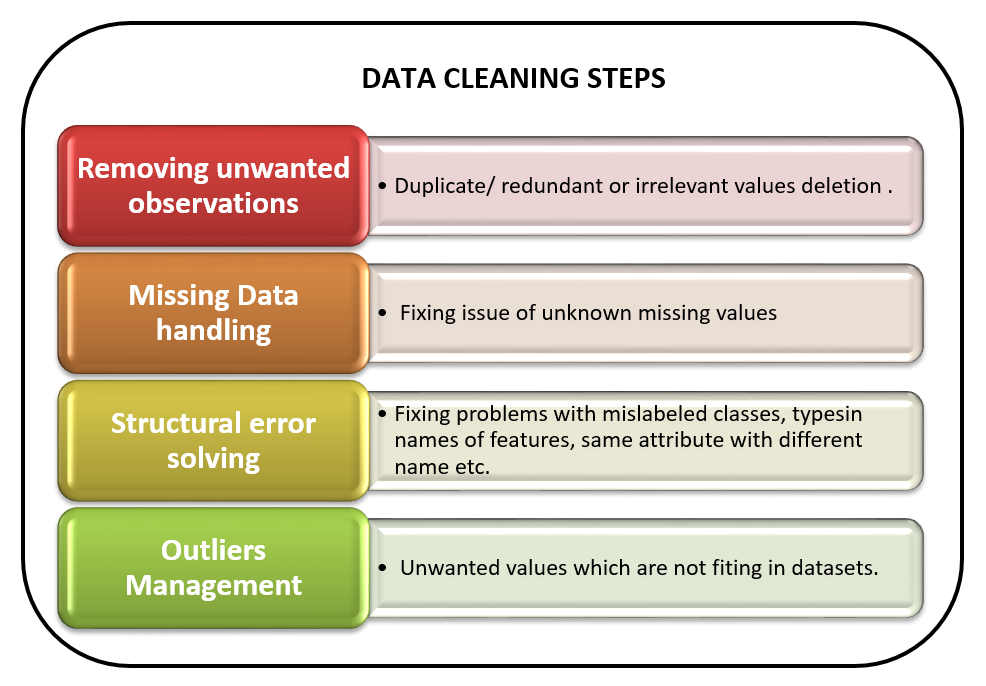
In this tutorial, we explain what data cleaning is and why it matters, then follow the steps in order: removing unwanted rows and columns, handling missing values, fixing structural errors and managing outliers. Everything is shown on one small, messy table with tested pandas code and the real output of each step. We also cover a point that most tutorials skip: how to fill missing values without leaking information from your test data. We finish with a checklist, common mistakes and an FAQ.
What is Data Cleaning?
Data cleaning is the process of finding and fixing problems in a dataset so that it is accurate, consistent and ready for analysis or modelling. The problems include missing values, duplicate rows, wrong entries, inconsistent labels, wrong data types and extreme values. It is also called data cleansing or data scrubbing, and it is the first part of data preprocessing.
The right steps depend on the dataset. A table of customer records and a set of sensor readings are broken in different ways. There is no single recipe, but the steps below cover the problems that come up most often.
Why does Data Cleaning Matter?
- Models learn what they see. Errors in the data become errors in the predictions.
- Many tools fail on blanks. Several algorithms stop with an error if any value is missing.
- Inconsistent labels split the groups. Berkeley and BERKELEY look like two different places to a computer.
- Decisions rest on the results. A wrong average based on dirty data can lead to a wrong business decision.
Data Cleaning Steps in Machine Learning
Follow these steps. We will go through each one with code. In the program, the structural fixes run before the gaps are filled, and the note under Step 3 explains why.
- Look at the data and count what is missing.
- Remove unwanted observations, which means duplicate rows and rows you do not need.
- Handle missing valuesby filling or removing them.
- Fix structural errors, such as inconsistent labels, wrong types and placeholder text.
- Manage outliers by checking whether they are errors or real.
- Check the result and keep a note of what you changed.
Our Example Data
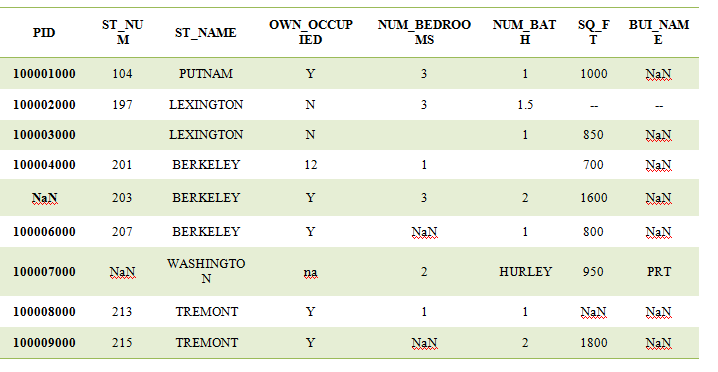
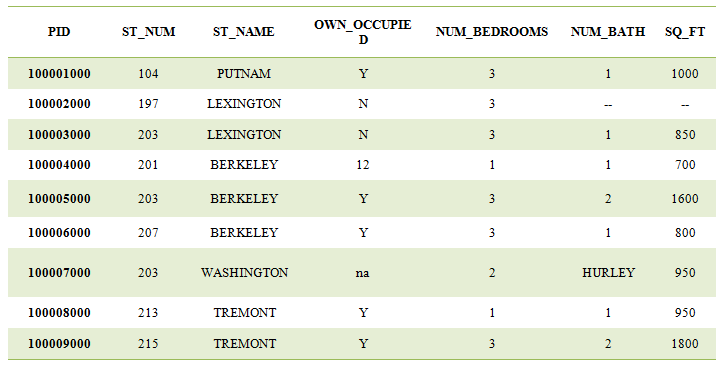
We will clean a small table of 10 properties, with the columns PID, ST_NUM, ST_NAME, OWN_OCCUPIED, NUM_BEDROOMS, NUM_BATH and SQ_FT. I built it to contain the problems you will meet in real life. The values are made up. It has placeholder text such as na and double dashes, a duplicate row, a word in a number column, and a street spelt two ways. The full program is below, and each step is explained after it.
Step 1: Look at the Data and Count What is Missing
Start by loading the file and counting the blanks in each column. Note that pandas will not treat text such as na, NA or a double dash as missing unless you say so. The na_values setting tells pandas which texts mean missing.
The original page uses isnull().any(), which only returns True or False for each column. Use isnull().sum() to see how many are missing, since 2 blanks in 10 rows is very different from 2 in 10,000.
Step 2: Remove Unwanted Observations
Observations are rows. Unwanted ones include exact duplicates and rows that are not relevant to your question. In the example, row 100004 appears twice.
Dropping duplicates with drop_duplicates() leaves 9 rows. Dropping a column is a different job, and it belongs to feature selection. You can drop columns that have no use, such as a building name, with drop and axis set to 1.
Be Careful With dropna()
dropna() removes every row that has even one missing value. It does not remove only the rows with the most blanks, as the original page says. On our small table, it would delete most of the rows. Use it only when very few rows are affected. To remove rows with too many blanks, set the thresh option, which keeps only rows that have at least that many real values.
Step 3: Handle Missing Values
You can remove rows with blanks, or fill the blanks with a sensible value. Removing is fine when very few rows are affected. Otherwise, fill them. The common choices are these:
| Method | Use it for | Watch out for |
|---|---|---|
| Median | Numbers, especially skewed ones such as area or income | Hides real variation |
| Mean | Numbers that are bell shaped | Pulled by outliers |
| Mode, the most common value | Labels such as Y or N | Can over represent the majority |
| Interpolation | Ordered data such as time series | Meaningless for IDs |
| Leave blank, add a flag | When missing itself carries meaning | Needs a model that can handle blanks |
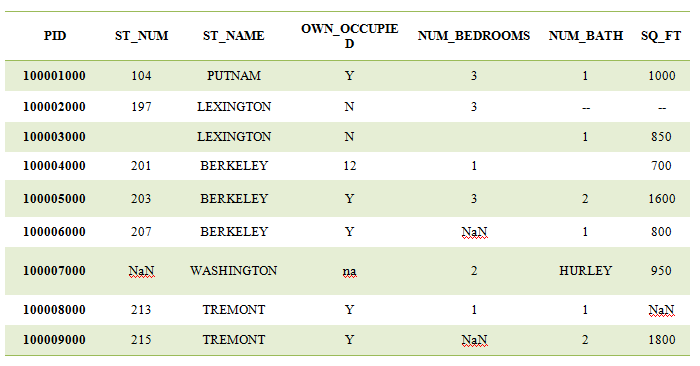
In the program, the structural fixes in Step 4 run first, because a column that still holds text cannot be filled with a median. The page follows the order of the original article, so read Steps 3 and 4 together. Bedrooms get the median rounded to a whole number, bathrooms and area get the median, and OWN_OCCUPIED gets the most common value. The median of bedrooms is 2.5, which rounds to 2. I did not fill PID or ST_NUM. A median street number or a median ID number means nothing, so those stay as they are. The original page interpolates PID, which has no meaning.
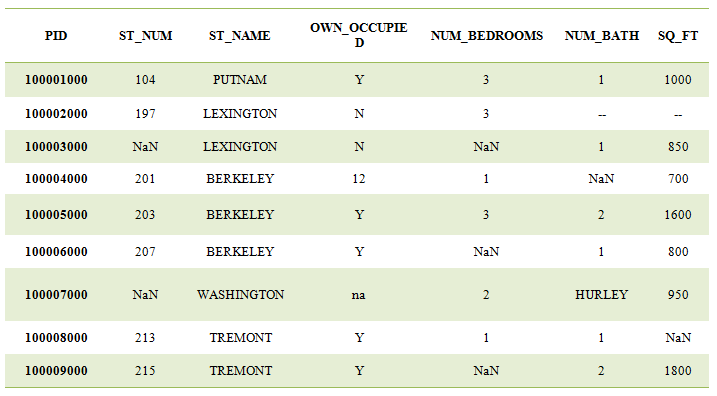
Every column that should be filled is complete. Only ST_NUM still has 2 blanks, on purpose. A column of identifiers is better left blank than filled with a made up value.
Fill Without Leaking: Use SimpleImputer
There is one important trap. If you calculate the median from the whole dataset and then split it into train and test, information from the test rows has flowed into the training data. This is called data leakage, and it makes scores look better than they will be in real use. The safe method is to learn the fill value from the training data only, and then apply it to both parts. SimpleImputer does exactly that:
The median of 900 was learned from the training rows alone. Use it with fit on the training data and transform on the test data, and put it in a pipeline so it happens automatically.
Step 4: Fix Structural Errors
Structural errors are inconsistencies in how the data is written. They come from typing, combining files, or different people entering data.
Inconsistent Labels
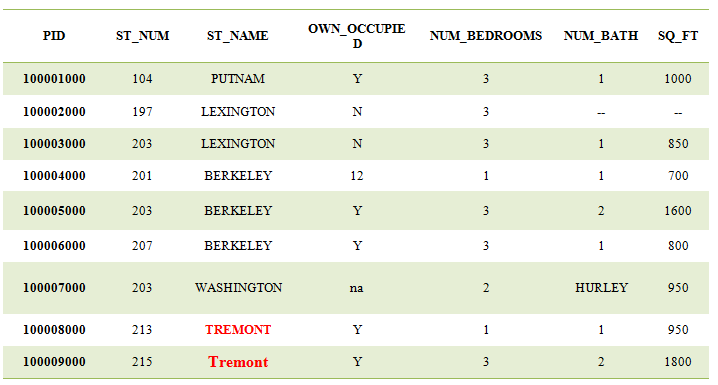
In our table, one street is written BERKELEY in some rows and Berkeley in another. Making the case consistent with str.upper() and removing extra spaces with str.strip() solves this.
Text in a Number Column
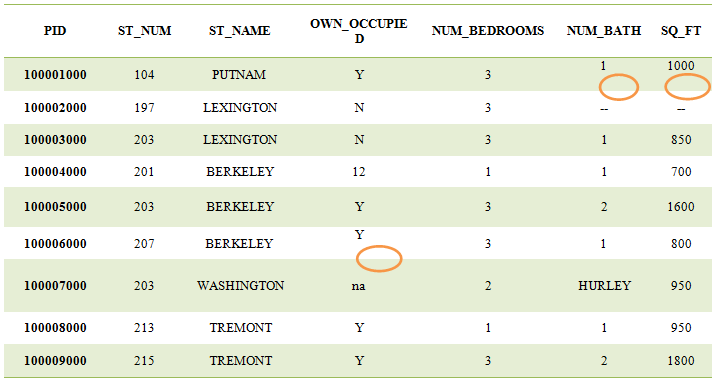
The NUM_BATH column holds the word HURLEY in one row, which makes pandas read the whole column as text. The simple fix is pd.to_numeric with errors set to coerce, which turns anything that is not a number into a missing value. That is shorter and safer than the loop in the original page, which assumed the index runs from 0 to n minus 1 and breaks after rows are dropped.
The first line shows the type before the fix, which is text. Older pandas versions call it object. The second line shows the type after the fix, which is a decimal number. Check data types with df.dtypes before and after.
Values That do Not Belong
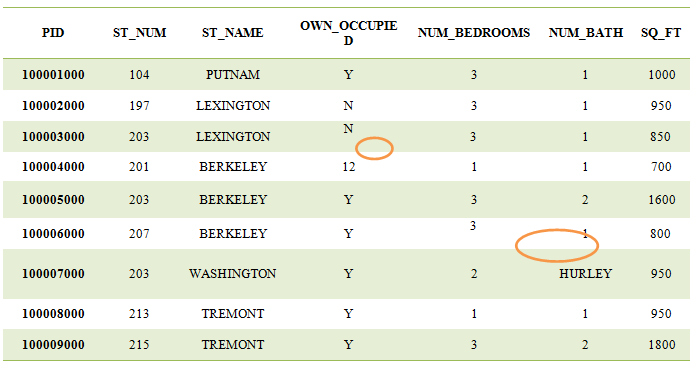
OWN_OCCUPIED should hold only Y or N, but two rows hold the number 12. A simple rule works well: keep the value only if it is Y or N, and otherwise treat it as missing. This is the reverse of the loop on the original page, which blanked the numbers it should have kept.
The 2 missing values here are one that was already blank and one that came from the bad value 12.
Bathrooms are Not Always Whole Numbers
The original page converts NUM_BATH to an integer. That is wrong, since half baths exist, and our table has a value of 1.5. Keep it as a decimal number. If you need whole numbers in a column that has blanks, use the nullable Int64 type, because the ordinary integer type fails when a blank remains.
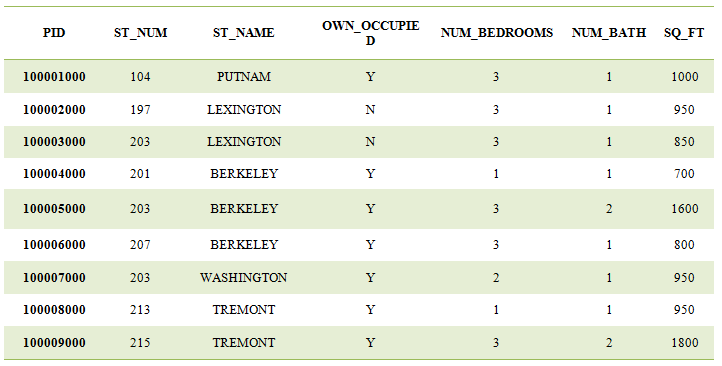
Here is the cleaned table after Steps 2, 3 and 4:
| PID | ST_NUM | ST_NAME | OWN_OCCUPIED | NUM_BEDROOMS | NUM_BATH | SQ_FT |
|---|---|---|---|---|---|---|
| 100001 | 104 | PUTNAM | Y | 3 | 1.0 | 1000 |
| 100002 | 197 | LEXINGTON | N | 3 | 1.5 | 950 |
| 100003 | blank | LEXINGTON | N | 2 | 1.0 | 850 |
| 100004 | 201 | BERKELEY | Y | 1 | 1.0 | 700 |
| 100005 | 203 | BERKELEY | Y | 3 | 2.0 | 1600 |
| 100006 | 207 | BERKELEY | Y | 2 | 1.0 | 800 |
| 100007 | blank | WASHINGTON | Y | 2 | 1.0 | 950 |
| 100008 | 213 | TREMONT | Y | 1 | 1.0 | 950 |
| 100009 | 215 | TREMONT | Y | 2 | 2.0 | 1800 |
The 10 rows became 9 after the duplicate was removed. The SQ_FT for property 100008 was blank. It is now 950, the median of the other areas.
Step 5: Manage Outliers
Outliers are values far from the rest. They are not always wrong. A very large flat can be real, while a flat of 1 square foot is surely a typing error. The right approach is to check the cause before changing anything. Keep real values, fix clear errors, and compare results with and without suspicious points. Do not remove them automatically. Our full guide to outliers shows how to detect them with box plots, the z score and the IQR rule, and why blind removal can throw away your most important rows.
A Data Cleaning Checklist
| Check | What to look for |
|---|---|
| Shape and types | Do the columns have the right types? Use df.dtypes |
| Missing values | Count them per column with isnull().sum() |
| Placeholder text | na, NA, a dash, a blank string, 999 or 0 used for unknown |
| Duplicates | Exact duplicate rows, and near duplicates |
| Labels | Spelling, case and spaces in text columns |
| Valid values | Ages below zero, a Y or N column holding numbers |
| Outliers | Check the cause before changing anything |
| Leakage | Learn fill values from training data only |
| Record of changes | Write down what you removed and why |
Common Mistakes to Avoid
- Missing the hidden blanks. Text like na, dashes and 999 hide as real values unless you list them in na_values.
- Filling before splitting. It leaks test information into training. Fit imputers on training data only.
- Filling identifiers. A median PID or street number is meaningless.
- Dropping every row with a blank. You may lose most of your data.
- Forcing integers. Bathrooms can be 1.5.
- Cleaning by hand in a spreadsheet. You cannot repeat it. Write the steps as code.
- Not keeping a record. You will not remember what you changed and why.
- Removing outliers automatically. Check the cause first.
Data cleaning is not exciting, but it is where good models begin. Work through the steps in order, write them as code so they can be repeated, learn fill values from training data only, and keep a note of every change. Run the program above on your own messy file, count the problems at each step, and you will see how much of your accuracy was hiding in the data all along.
