Confidence interval
Confidence Interval Tutorial
Confidence interval tutorial, Welcome to the world of confidence interval statistics in Data science. In the previous section, we have learned about Co-efficient of Determination in data science and how it calculates. Now, we will talk about confidence interval in data science.
Having knowledge of statistical models will be a strong benefit to the Data analyst. In this tutorial, one can easily learn about confidence interval definition and how to calculate it with examples. Are you also dreaming to become certified in the Data Science, then stop just dreaming get your advanced Data science training from India’s Leading Data science training institute in Bangalore.
Confidence Interval Definition
A Confidence Interval can be stated as, a range of values we are fairly sure our true value lies within.
The confidence interval is a way to display what the uncertainty is with a certain statistic (i.e. from a certain poll or survey).
The confidence level describes the uncertainty associated with a sampling method. Suppose we used the same sampling method to select different samples and to compute a different interval estimate for every sample. Some interval estimates will include the true population parameter and some would not.
A 90% confidence level means that we would expect 90% of interval estimates to include the population parameter; a 95% confidence level means that 95% of the intervals would include the parameter; and so on.
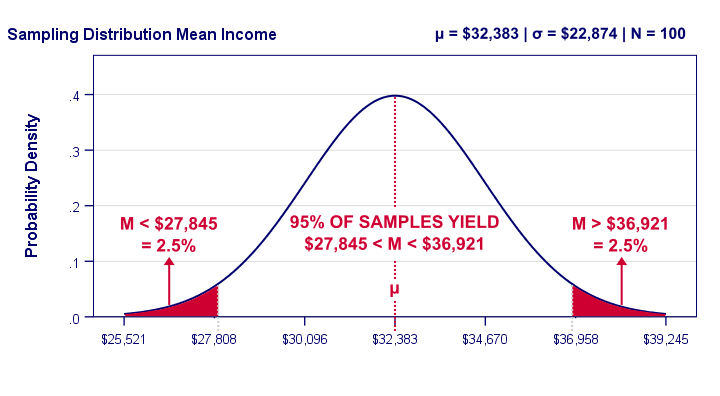
For example, a poll may state that there is a 92% confidence interval of 6.48 and 9.56. That means if the poll is repeated using the same techniques, 92% of the time the true population parameter will fall between the interval estimated.
Why we use Confidence interval?
Statisticians use a confidence interval to describe the quantity of uncertainty associated with a sample estimate of a population parameter.
For example, In Indian Elections Pools (incorrectly) stated that Rahul would win the 2018 election with Rahul at 49% and Modi at 48%. The stated confidence level was 98% with a Margin of error of +/- 2, which means that the results were calculated to be accurate to within 2 percentage points 98% of the time.
The real results from the election were: Modi 51%, Rahul 47%, which was actually even outside the range of the Indian poll’s margin of error (2 percent), showing that not only can statistics be wrong, but polls can be too.
How to Calculate Confidence interval?
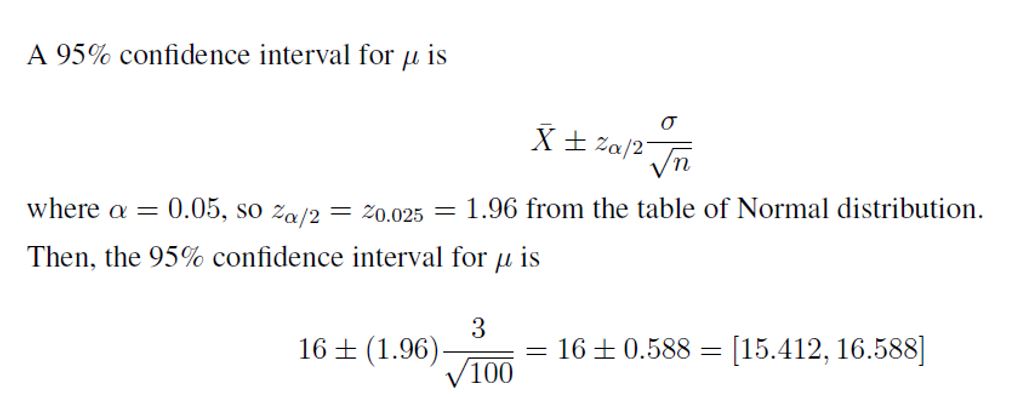
A sample of size n = 100 produced the sample mean of x̅ = 16. Assuming the population standard deviation µ = 3, compute a 95% confidence interval for the population mean µ.
Confidence Interval Example
Hence, in this confidence interval tutorial, we discussed basics of confidence interval in data science and also how to calculate it with examples.
Still, Interested in learning more? or Do you want to get in-depth knowledge of Data Science? Then Take Data science Training from today itself under 15+ Years of hands-on experienced Professionals from Prwatech.


