One Tail Test
One Tailed Test: Definition, Formula and Worked Examples
A company says its new painkiller works faster than the old one. Nobody cares if it works slower, because that would simply mean the company should not sell it. The only question is whether it is better. When you ask a question with one direction, a one tailed test is the right tool.
A one tailed test puts the whole rejection area in one end of the curve. This gives it more power to detect a change in the direction you care about. That power comes with a rule: you must choose the direction before you see the data. If you pick it afterwards, your p value cannot be trusted.
This tutorial explains what a one tailed test is, the difference between left tailed and right tailed tests, the formula and critical values, three worked examples with every step shown, how to choose between one tailed and two tailed, and how to run the test in Python.
One Tailed Test Definition
A one tailed test, also called a one sided test, is a hypothesis test in which the rejection region lies in only one tail of the sampling distribution. You reject the null hypothesis only if the test statistic is extreme in the direction stated in the alternative hypothesis.
At a 5 percent significance level, the full 5 percent is placed in one tail. On the standard normal curve, the critical value is 1.645 (or minus 1.645 for the left tail). The live page says over 5 percent of significance. The correct idea is that the rejection area is 5 percent, all in one tail.
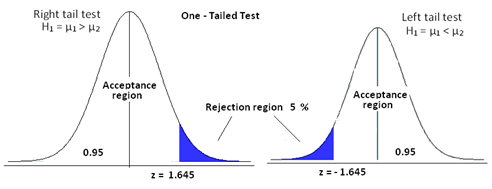
Left Tailed and Right Tailed Tests
| Point | Left tailed test | Right tailed test |
|---|---|---|
| Question asked | Is the value less than the claim? | Is the value greater than the claim? |
| Hypotheses | H0: mu is 800 or more. H1: mu is less than 800 | H0: mu is 800 or less. H1: mu is greater than 800 |
| Rejection region | Left tail | Right tail |
| Critical Z at 0.05 | Minus 1.645 | Plus 1.645 |
| Reject H0 when | Z is less than minus 1.645 | Z is greater than 1.645 |
| p value | Area to the left of Z | Area to the right of Z |
Critical Values for a One Tailed Test
| Significance level (alpha) | Right tail critical Z | Left tail critical Z |
|---|---|---|
| 0.10 | 1.282 | Minus 1.282 |
| 0.05 | 1.645 | Minus 1.645 |
| 0.01 | 2.326 | Minus 2.326 |
For comparison, a two tailed test at 0.05 uses 1.96 on each side. That is why a one tailed test finds a result significant more easily in its chosen direction.
Why Use a One Tailed Test?
Use it when only one direction matters, and you can state that direction before you collect the data. Typical cases:
- Is the new process faster than the old one?
- Does the new batch have a lower defect rate than the limit?
- Is the pass rate higher than the target?
The benefit is power. For the same data and alpha, the one tailed p value is half of the two tailed p value, when the result is in the expected direction. The risk is that you completely ignore an effect in the other direction. If a surprising result in the other direction would still matter to you, use a two tailed test.
About the Normal Distribution
The live page says the data must be normally distributed. In practice, it depends. With a large sample, or a known population standard deviation, the Z test works well because of the central limit theorem. With a small sample and an unknown standard deviation, use a T test, which assumes the data are roughly normal. The one tailed idea works the same way in both.
The One Tailed Test Formula
For a Z test of a mean:
The bottom part is the standard error. For a one tailed test, the p value uses only one tail:
- Right tailed: p = area to the right of Z.
- Left tailed: p = area to the left of Z.
The live page has no formula at all, so the title promise of Formula was not met.
How to Use a One Tailed Test? Step by Step
- Choose the direction first. Left or right, based on the question, before looking at the data.
- State the hypotheses. For example, H0: mu is 800 hours or less. H1: mu is greater than 800 hours.
- Choose alpha, usually 0.05.
- Find the critical value. 1.645 for the right tail, or minus 1.645 for the left.
- Calculate the test statistic, Z or t.
- Decide. Reject H0 if the statistic is in the rejection region, or if the p value is below alpha.
- Write the conclusion in plain words.
Example 1: Right Tailed Z Test (Bulb Life)
A maker claims that its bulbs last 800 hours. You suspect that they last longer. You test 64 bulbs and find a mean of 812 hours. The standard deviation is known to be 40 hours. The numbers are made up for teaching.
- Hypotheses. H0: mu is 800 or less. H1: mu is greater than 800. This is a right tailed test.
- Critical value at 0.05: 1.645.
- Standard error = 40 divided by the square root of 64 = 5.
- Z = (812 minus 800) divided by 5 = 2.40.
- p value = area to the right of 2.40 = 0.0082.
Conclusion: Z of 2.40 is above 1.645, and p is below 0.05. We reject the null hypothesis. There is evidence that the bulbs last longer than 800 hours.
Example 2: Left Tailed Z Test (Filling Machine)
A machine should fill 500 ml bottles. You worry that it underfills. A sample of 36 bottles has a mean of 495.5 ml, and the known standard deviation is 12 ml. The numbers are made up.
- Hypotheses. H0: mu is 500 or more. H1: mu is less than 500. This is a left tailed test.
- Critical value at 0.05: minus 1.645.
- Standard error = 12 divided by the square root of 36 = 2.
- Z = (495.5 minus 500) divided by 2 = minus 2.25.
- p value = area to the left of minus 2.25 = 0.0122.
Conclusion: minus 2.25 is below minus 1.645, and p is below 0.05. We reject the null hypothesis. The machine fills less than 500 ml on average. Notice that the Z value is negative here. That is the sign of a left tailed result. A two tailed test on the same data would give p = 0.0245, which is also significant, but this is double.
Example 3: The Drug Example with Real Numbers
The live page describes a new drug tested against an older one for headaches, but gives no numbers. Here is a made up version. The time to relief, in minutes, is measured in 12 patients on each drug.
| Measure | New drug | Old drug |
|---|---|---|
| Sample mean (minutes) | 33.25 | 41.50 |
| Sample size | 12 | 12 |
- Hypotheses. H0: the new drug is not faster, so the mean time is the same or longer. H1: the new drug has a shorter mean time. This is a left tailed test.
- Test. A two sample T test (Welch) is used because the standard deviations are unknown.
- Result. t = minus 4.89, one sided p = 0.000035.
Conclusion: we reject the null hypothesis. The new drug relieves headaches faster in this data. Now see why the direction rule matters. Had the new drug been slower, a one tailed test in the left direction could never have flagged it. If that would matter, for example for patient safety, you need a two tailed test.
One Tailed vs Two Tailed Test
| Point | One tailed | Two tailed |
|---|---|---|
| Alternative hypothesis | Greater than, or less than, in one direction | Different from the claim, in either direction |
| Rejection region | One tail, 5 percent at alpha 0.05 | Both tails, 2.5 percent each |
| Critical Z at 0.05 | 1.645 or minus 1.645 | Minus 1.96 and plus 1.96 |
| p value | One tail area | Twice the one tail area |
| Power | Higher in the chosen direction | Lower in each direction |
| Risk | Misses an effect in the other direction | Needs more data |
| Use when | Only one direction matters, fixed in advance | Any change matters, or you have no strong prior |
Never switch to a one tailed test after seeing that the data lean one way. That halves the p value unfairly and doubles the real false positive rate. When in doubt, use two tailed.
Run a One Tailed Test in Python
I ran the code below, and the output is real.
In SciPy, set alternative to less for a left tailed test, greater for a right tailed test, and two sided for a two tailed test. The sign of the statistic must match the direction you chose.
Common Mistakes to Avoid
| Mistake | Fix |
|---|---|
| Choosing the direction after seeing the data | Fix the direction before the test |
| Mixing up the left and right tails | Left means H1 is less than, Z is negative. Right means H1 is greater than, Z is positive |
| Using 1.96 for a one tailed test | Use 1.645 at alpha 0.05 |
| Doubling the p value in a one tailed test | Use one tail area only |
| Using a one tailed test when the other direction also matters | Use a two tailed test |
| Using a Z test with a small sample and unknown standard deviation | Use a T test |
| Saying the claim is proved | Say that there is enough, or not enough, evidence |
Practice Questions
- What is the critical Z value for a right tailed test at alpha 0.01?
- A left tailed test gives Z = minus 1.40. Is it significant at 0.05?
- For a right tailed test, Z = 1.80 and the area to the right is 0.0359. What is the p value? What would the two tailed p value be?
- Why can a one tailed test not be chosen after seeing the data?
Answers: 1) 2.326. 2) No, because minus 1.40 is not below minus 1.645. 3) The p value is 0.0359, which is significant at 0.05. The two tailed value is 0.0718, which is not. 4) Because choosing the direction after the data inflates the false positive rate. These are my own answers, so please recheck them before publishing.
A one tailed test is a sharp tool. It gives you more power when only one direction matters, but only if you choose that direction before you see the data. Decide the hypotheses and alpha first, use 1.645 at 0.05, and when an opposite result would also matter, use a two tailed test.
