Regression Analysis
Regression Analysis Tutorial: Meaning, Types and Examples
This regression analysis tutorial explains what regression analysis is, when you need it, and the main types of regression analysis used in data science and machine learning, with practical examples for each. It is written for beginners moving into a data analyst or data scientist role, and it stays at the concept level before you get into code.
What is Regression Analysis?
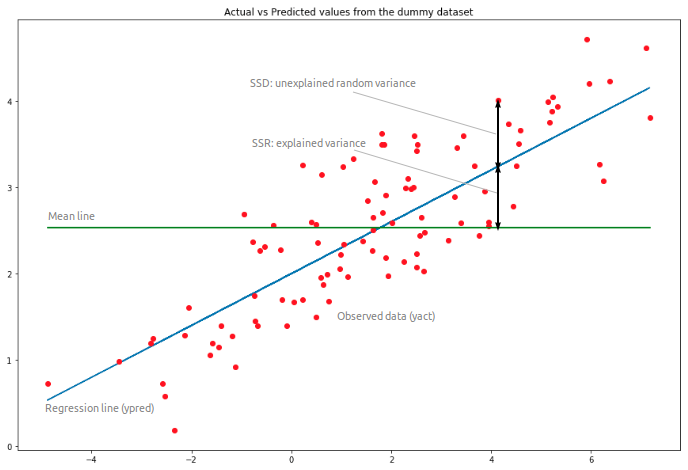
Regression analysis is a statistical method used in statistics and machine learning to study the relationship between variables. It looks at a set of observations, where each observation has two or more features, and works out how one feature depends on the others.
In practical terms, regression analysis finds a function that maps one or more input variables to an output variable, closely enough to be useful for explanation or prediction. Linear regression is the most widely used method for this, mainly because the results are easy to interpret.
Independent and Dependent Variables: An Example
Take a set of employees at a company. You want to understand how their salaries depend on factors such as experience, education level, role, and the city they work in.
Here, salary is the dependent variable, the outcome you are trying to explain. Experience, education, role, and city are the independent variables (also called inputs or predictors), the factors assumed to influence that outcome.
A regression problem usually has one continuous, unbounded dependent variable, while the independent variables can be continuous, discrete, or categorical (for example gender, nationality, or brand). In standard notation, the output is written as y and the inputs as a vector x = (x1, …, xr), where r is the number of inputs used.
When Do You Need Regression Analysis?
Regression is the right tool in two common situations:
- To measure whether and how much one factor influences another, for example, whether experience or gender affects salary.
- To forecast an outcome from new inputs, for example, predicting a household’s water consumption next week from outdoor temperature, time of day, and household size.
Regression analysis is used across economics, computer science, and the social sciences, and its role has grown as more data has become available and organisations have put more value on evidence-based decisions.
Types of Regression Analysis
Linear Regression
Linear regression is the most widely used regression technique and one of the simplest. Its main advantage is that the results are straightforward to interpret, you can see directly how each input affects the output.
Simple Linear Regression
Simple linear regression is the most basic form of linear regression: it uses a single independent variable, so y = f(x).
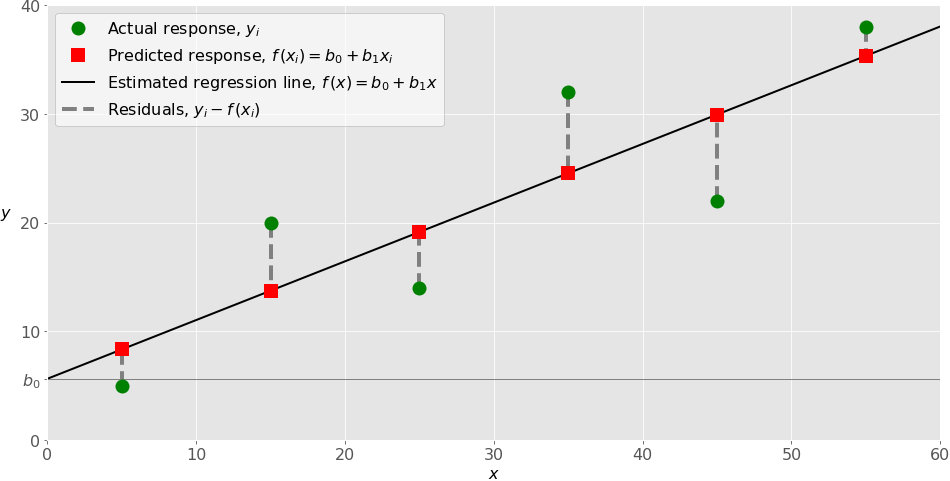
You start with a set of input-output pairs — your observations. The estimated regression function is then a straight line with the equation:
f(x) = b0 + b1x
where b0 is the intercept and b1 is the slope, both estimated from the data.
Steps to Build a Regression Model
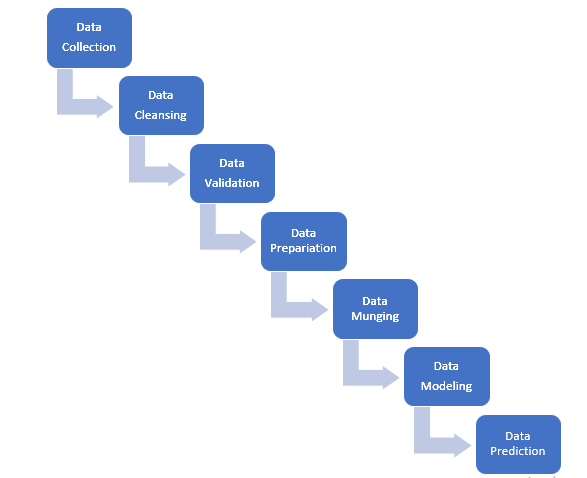
At a high level, building a regression model in machine learning follows this sequence: prepare the data, select features, choose and fit a model, then validate and interpret the results.
Feature Selection Methods for Regression Models
The different techniques of Feature Selections are as follows:
- Forward Selection
- Backward Elimination
- Recursive Feature Elimination
- Uni variate Selection
- Feature Importance
- Correlation Matrix with a Heat map
Forward Selection: Forward selection is an iterative method in which one starts with having no feature in a model. In every iteration, we keep adding the feature that best improves the model until the addition of a new variable doesn’t improve the performance of the model.
Backward Elimination: In backward elimination, we start with considering all the features and keep on removing the least significant feature at each iteration which improves the performance of the model. We will repeat this until there no improvement is observed on the removal of features.
Recursive Feature elimination: It is actually a greedy optimization algorithm that targets to identify the best performing feature subset. It repeatedly creates models and keeps aside the best or worst performing feature in every iteration. It will construct the next model with the left features until all the features are exhausted. It will then ranks features based on the order of their elimination.
Uni variate Selection: Statistical tests could be used to select those features that have the strongest relationship with the output variable. The scikit-learn library provides the SelectKBest class that can be used with a set of different statistical tests to select a particular number of features.
Feature Importance: You can get feature importance for each feature of your data set by using the feature importance property of the model. Feature importance gives you a score for every feature of your data, higher the score more relevant is the feature towards your output variable.
Correlation Matrix with Heat map: Correlation displays how the features are related to each other or to the target variable. Correlation may be positive (increase in one value of feature increases the value of the target variable) or the negative (increase in one value of feature decreases the value of the target variable).
# Last but not least, always ask for help!
We hope you have understood the basics of the regression analysis tutorial with examples in data science. Interested in learning more? Then get enroll with Prwatech for advanced Data science training institute with 100% placement assistance.