Sample Mean Vs Population Mean
Sample Mean vs Population Mean: Difference, Formula and Examples
Before an election, a survey agency asks 2,000 voters whom they will vote for, and then says how the whole country will vote. It cannot ask all voters, so it asks a few and uses the result to say something about everyone. The average of the few is a sample mean. The average of everyone would be the population mean. The gap between the two is what statistics is built to handle.
Many beginners treat these as two names for the same thing. They are not. One is a number you can always calculate, and the other is usually a number you can never see. Mixing them up leads to wrong formulas, wrong symbols and overconfident conclusions.
This tutorial explains what each mean is, how they differ, the formulas and symbols, a worked example, why a sample mean is a good estimate, how far off it can be, and how to check it in Python. If you need a refresher on the average itself, read our measures of central tendency tutorial first.
What are the Sample Mean and the Population Mean?
A population is the whole group you want to know about, such as all voters in a country, all the parts a machine makes, or all students in a class. A sample is a smaller part of that group that you actually measure.
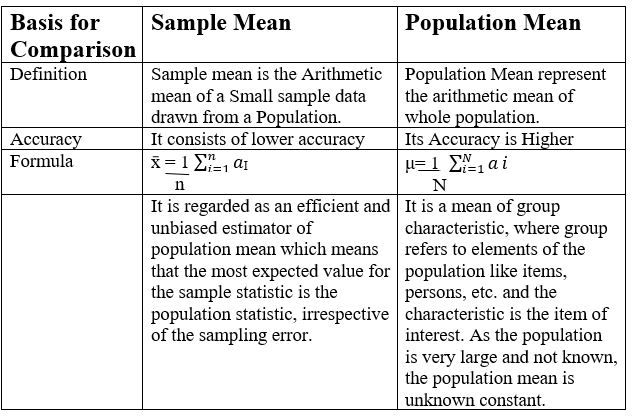
- The population mean is the arithmetic mean of every member of the population. It is a fixed value. The symbol is the Greek letter mu.
- The sample mean is the arithmetic mean of the members of a sample. It changes from one sample to the next. The symbol is x bar.
The population mean is the exact answer for that population. The sample mean is an estimate of it. A sample mean is not used to predict an outcome directly. It is used to estimate the population mean.
Sample Mean and Population Mean Examples
Example 1: Election Survey
You cannot ask every voter in a nation, so you ask a sample and use its result to estimate the share of the whole population that supports each party. The sample share is a sample statistic. The true share, which you only learn on counting day, is the population value.
Example 2: Marks of a Class
A teacher wants the average percentage of marks of her class of 20. She has the marks of all 20 students, so the average she calculates is the population mean, because the class is the whole group she cares about. If she used only the marks of five students, that average would be a sample mean.
Here is a worked version with my own numbers. The 20 marks are 45, 52, 58, 60, 62, 64, 66, 68, 70, 71, 73, 75, 77, 79, 81, 84, 86, 90, 93 and 95. Their mean is 72.45, the population mean. Now pick five students at random, with marks 52, 64, 71, 86 and 93. The sample mean is 73.2, which is 0.75 higher than the population mean. A different sample of five would give a different answer.
Sample Mean and Population Mean Formula
| Feature | Population mean | Sample mean |
|---|---|---|
| Symbol | mu | x bar |
| Formula | The sum of all values divided by N | The sum of the sample values divided by n |
| Count | N, the size of the population | n, the size of the sample |
| Value | Fixed, usually unknown | Calculated from data, varies by sample |
The arithmetic is the same. Only the group, and the letters, change. Use capital N for the population size and small n for the sample size.

How to Find the Sample Mean and Population Mean
The question on the live page: a gym surveyed 107 members about how many meals they eat in a day. Find the mean.

| Meals per day | People | Meals times people |
|---|---|---|
| 1 | 12 | 12 |
| 2 | 17 | 34 |
| 3 | 38 | 114 |
| 4 | 22 | 88 |
| 5 | 18 | 90 |
| Total | 107 | 338 |
Mean = 338 divided by 107 = 3.16 meals a day. The live page gives no final answer.
Is It a Population Mean or a Sample Mean?
It depends on what you want to say. If the question is about these 107 members only, and every one of them answered, then 3.16 is the population mean of that group. If you want to say that gym goers in general eat about 3.16 meals a day, then the 107 are a sample, and 3.16 is a sample mean that estimates the wider population. The live page calls it a population mean without saying which. Always state the group you are describing.
Why the Sample Mean Is a Good Estimate
A sample mean will rarely equal the population mean exactly, but it is not biased. If you took many samples, their means would centre on the population mean. Larger samples land closer to it. I checked this with a simulation. The population has 100,000 values with a mean of 70 and a standard deviation of 10. I drew 5,000 random samples of each size and recorded the sample means.
| Sample size n | Average of the sample means | Spread of the sample means (standard deviation) |
|---|---|---|
| 5 | 69.94 | 4.50 |
| 30 | 69.99 | 1.86 |
| 100 | 69.99 | 1.00 |
Two things stand out. The sample means centre on 70, the population mean, for every size. And the spread shrinks as the sample grows: 4.50 for samples of 5, 1.86 for 30 and 1.00 for 100. This is not a coincidence.
Standard Error of the Mean
The spread of sample means is called the standard error. Its formula is the population standard deviation divided by the square root of n. For our population, 10 divided by the square root of 100 = 1.0, which matches the simulation. To make the error half as large, you need four times as many observations, not twice.
In practice you rarely know the population standard deviation, so you use the sample standard deviation in its place. Our sample variance and standard deviation tutorials explain how.
Sample Mean vs Population Mean: Summary Table
| Feature | Population mean | Sample mean |
|---|---|---|
| Describes | The whole group | A part of the group |
| Symbol | mu | x bar |
| Changes between samples? | No, it is fixed | Yes |
| Usually known? | Rarely | Yes, you calculate it |
| Role | The target | The estimate of the target |
| Accuracy | Exact for that population | Close, and gets closer as n grows |
Calculate Both in Python
I ran the code below, and the output is real.
The same function, statistics.mean, gives both. Python does not know which one you mean. You decide by what the data represents.
Common Mistakes
| Mistake | Fix |
|---|---|
| Calling every average a population mean | Ask whether the data covers the whole group or a part of it |
| Using mu for a sample mean | Use x bar for samples, mu for populations |
| Expecting the sample mean to equal the population mean | It varies. Report the error |
| Using a tiny sample for a big claim | Spread shrinks with the square root of n, so size matters |
| Using a biased sample | A non random sample can be far off however large it is |
| Mixing N and n | Capital N is the population size, small n is the sample size |
The fourth and fifth rows go together. A larger sample reduces random error, but not bias. If the sample is picked badly, for example by only surveying people who are easy to reach, its mean can be far from the population mean however many people you ask.
Practice Questions
- A population has the values 4, 6, 8, 10 and 12. Find the population mean.
- A sample of 6, 10 and 12 is drawn from it. Find the sample mean, and how far it is from the population mean.
- The standard deviation of a population is 10. Find the standard error of the sample mean for n = 25.
- A company’s HR team calculates the average salary of all 250 employees of the company. Is this a population mean or a sample mean?
Answers: 1) 40 divided by 5 = 8. 2) 28 divided by 3 = 9.33, which is 1.33 above the population mean. 3) 10 divided by the square root of 25 = 2. 4) A population mean, because the HR team has data on every employee of the company. These are my own calculations, so please recheck them before publishing.
The arithmetic of the two means is identical, but the meaning is not. Before you calculate, say which group your numbers cover and which group you want to describe. That one habit tells you the right symbol, the right formula and how much to trust the answer.
