Correlation and Causality tutorial
Correlation and Causality Tutorial, welcome to the world of correlation and causality in Data science. Now, we are going to cover what it is, differences between correlation and causality. Along with this, we will study why it is important and formula with examples.
Thinking of having a career as a Data analyst? Planning to go for a certification in Data science and related subjects but still not getting a conviction whether it is the right thing to do or not? Confused about whether to invest time in gaining knowledge of Data science or not? Such questions can give you sleepless nights, but by taking an advanced data science course from India’s largest E-Learning data science training institute in Bangalore, I am sure that you will get a lot of reasons to build a data science career.
Correlation and Causality Definition
Two or more variables considered to be related, in a statistical factor, if the value of one variable increase or decrease then the value of the other variable (although it may be in the opposite direction).
If we consider the two variables “hours” worked and “salary” increases, as the price of wages increases a person’s ability to work will also increase (assuming a constant income).
Difference Between Correlation and Causality
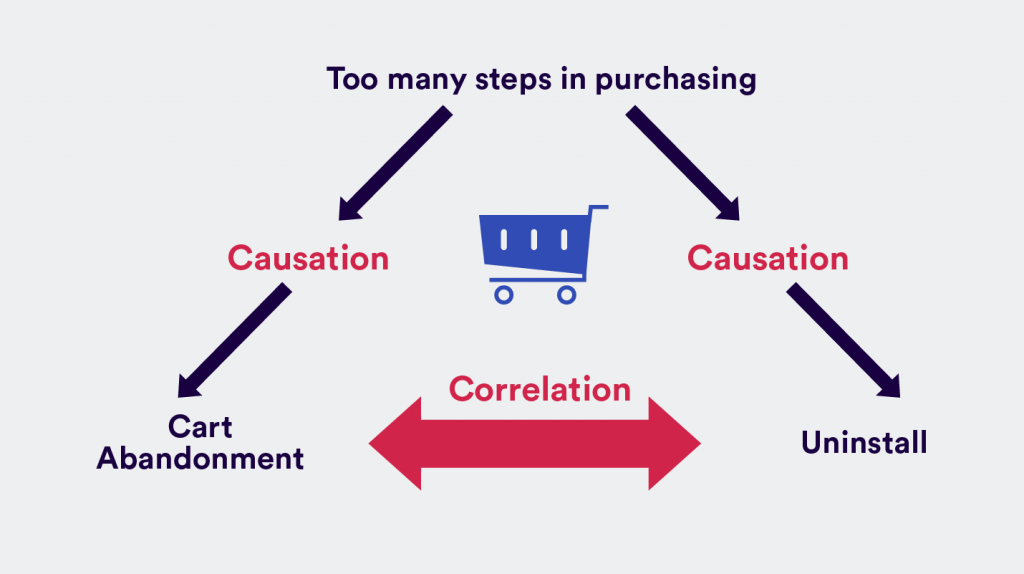
Correlation is a statistical unit that describes the size and direction of a relationship between two or more variables. A correlation between variables, however, does not automatically mean that the change in a variable is the cause of the change in the values of another variable. Causation denotes one event is the result of the phenomenon of the other event; i.e. there is a causal relationship between the 2 events. In practice, however, it remains tough to clearly establish cause and effect, compared with establishing correlation.
Why are correlation and causation important?
The reason for much research or scientific analysis is to determine the extent to which a variable relates to another variable. For example:
Is there a relationship between a person’s education level and his health?
Did a company’s marketing campaign will increase their product sales?
These and some other questions are making understand whether a correlation exists between the 2 variables, and if there is a correlation then this may guide further research into determining whether one action causes the other.
How is the correlation measured?
For two variables, a statistical correlation is determined by the use of a Correlation Coefficient, represented by the symbol (r), that is a single number that indicates the degree of relationship between two variables.
The coefficient’s numerical value ranges from (+1.0 to –1.0), which provides a description of the strength and direction of the relationship.
If the correlation coefficient consists of a negative value i.e. below 0, it will display a negative relationship between the variables. This means that the variables move in the opposite direction.
If the correlation coefficient has a positive value (above 0) it indicates a positive relationship between the variables meaning that both variables move in tandem, i.e. as one variable decreases the other also decreases, or when one variable increases the other also increases.
Where the correlation coefficient is 0 this indicates there is no relationship between the variables (one variable can remain constant while the other increases or decreases).
While the correlation coefficient is a useful measure, it has its limitations:
Correlation coefficients are usually associated with measuring a linear relationship.
For example, if you compare hours worked and income earned for a tradesperson who charges an hourly rate for their work, there is a linear (or straight-line) relationship since with each additional hour worked the income will increase by a consistent amount.
If, however, the tradesperson charges based on an initial call-out fee and an hourly fee which progressively decreases the longer the job goes for, the relationship between hours worked and income would be non-linear, where the correlation coefficient may be closer to 0.
For example, sale of an ice cream candy and the sale of a sunscreen lotion can increase and decrease throughout a year in a systematic pattern, but it can be a relationship that can be due to the effects of the season (i.e. hotter the weather sees an increase in people wearing sunscreen lotion as well as eating an ice cream candy) rather than due to any direct relationship between sales of sunscreen and ice cream.
The correlation coefficient must not be to say anything about cause and effect relationships. By examining the value of ‘r’, we can conclude that two variables are related, but that ‘r’ value does not indicate if one variable was the cause of the change in the other.
How can causation established?
The use of a controlled study is the most effective pattern of creating causality between two variables.
Correlation and causation examples
In medical research, one group might given a placebo while the other group is a new type of medication. If the two groups have determinable different outcomes, the different experiences may have caused the different outcomes.
Due to ethical reasons, there are limits to the use of controlled studies; it would not be appropriate to use two comparable groups and have one of them undergo a harmful activity while the other does not. To overcome this situation, observational studies are often to investigate correlation and causation for the population of interest. The studies can look at the groups’ behaviors and outcomes and observe any changes over time. .
Hope you enjoyed reading this blog. Get to know more about the impact of Data Science on various domains by being a part of the Prwatech based program of Data Science training in Bangalore.

