Mean squared error of regression line
Mean Squared Error of Regression Line Tutorial
Mean squared error of regression line tutorial, Are you the one who is looking for the best platform which provides information about mean squared error in data science? then welcome to the land of Squared error of regression line tutorial. Before proceeding, we recommend you to go through our previous blog in this series on the need for type 1 and type 2 errors in data science. In this tutorial, one can explore about regression line, mean squared error definition, how to calculate mean squared error with examples.
Are you the one who is looking for the best platform to learn Data science tutorials? Or Are you the one who is dreaming to become an expert data scientist? Then stop dreaming yourself, start taking Data Science training from Prwatech, who can help you to guide and offer excellent training with highly skilled expert trainers with the 100% placement. Follow the below mentioned Squared error of regression line in data science and enhance your skills to become pro Data Scientist.
What is Regression Line?
Regression is a statistical measurement used in finance, investing attempts to identify the strength of the relationship between a dependent variable (usually denoted by Y) and a series of other changing variables (known as independent variables).
Regression helps investors and financial managers to value assets and understand the relationships between variables, such as commodity prices and the stocks of businesses dealing in those commodities.
There are two basic types of regressions:
►Linear Regression.
►Multiple Linear Regression.
Also, there are some non-linear regression methods for more complicated data and analysis.
Linear regression uses an independent variable to predict the outcome of the dependent variable Y, while multiple regression uses two or more independent variables to predict the outcome.
Why we use Regression?
Regression can help financer’s and investment professionals as well as professionals in other businesses.
Regression can also help to predict sales for an organization based on weather, previous sales, GDP growth or other types of conditions. The capital asset pricing model often uses a regression model in finance for pricing assets and discovering the costs of capital.
Regression takes a group of some random variables, thought to be predicting Y, and tries to determine a mathematical relationship between them. This relationship is in the form of a straight line (linear regression) that best approximates all the individual data points.
In multiple regression, the separate variables are differentiated by using numbers with subscripts.
How to calculate Regression?
The general form of each type of regression is:
Linear regression: Y = a + bX + u
Multiple regression: Y = a + b1X1 + b2X2 + b3X4 + … + btXt + u
►Where:
Y = the variable that you are trying to predict (dependent variable).
X = the variable that you are using to predict Y (independent variable).
a = the intercept.
b = the slope.
u = the regression residual.
Mean Squared Error of Regression
The mean squared error shows you how close a regression line is to a set of points. It does this by taking distances from the points to the regression line (these distances are actually the “errors”) and squaring them. The squaring is necessary in order to remove any negative signs. It also gives more weight to larger differences. It’s known as the mean squared error as you’re finding the average of a set of errors.
Examples of Mean squared error
Find the Mean Squared Error?
| Height | 43 | 44 | 45 | 46 | 47 |
| Weight | 41 | 45 | 49 | 47 | 44 |
Step 1: Find the regression line.
y= 9.2 + 0.8x.
Step 2: Find the new Y’ values:
9.2 + 0.8(43) = 43.6
#9.2 + 0.8(44) = 44.4
9.2 + 0.8(45) = 45.2
#9.2 + 0.8(46) = 46
9.2 + 0.8(47) = 46.8
Step 3: Find the error (Y – Y’):
41 – 43.6 = -2.6
45 – 44.4 = 0.6
49 – 45.2 = 3.8
47 – 46 = 1
44 – 46.8 = -2.8
Step 4: Square the Errors:
-2.62 = 6.76
0.62 = 0.36
3.82 = 14.44
12 = 1
-2.82 = 7.84
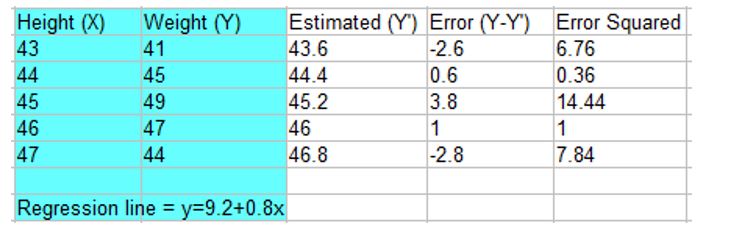
Step 5: Add all of the squared errors up: 6.76 + 0.36 + 14.44 + 1 + 7.84 = 30.4.
Step 6: Find the mean squared error:
30.4 / 5 = 6.08.
Planning towards becoming a skilled expert in Data Science? If so, be a part of the Prwatech learning program of Data Science Training in Bangalore.


