Measures of Central Tendency
Measures of Central Tendency Tutorial
Measures of central tendency tutorial: Sound knowledge of statistics helps an analyst to make effective business decision plans. In this tutorial, one can learn of all measures of central tendency in Data science to calculate mean, median and mode and under what conditions the measures are appropriate to be used in data science.
Are you the one who is looking to learn data science? Or Are you the one who is looking for the best platform to learn Data science tutorial? Or Are you the one who is dreaming to become an expert data scientist? Then Your dream will come true if you start learning from Prwatech, India’s leading Data science training who can help you to guide and offer advanced Data science training with the best trainers.
Measures of Central Tendency Definition
Central Tendency is a descriptive summary of a dataset that represents the data into a single value.
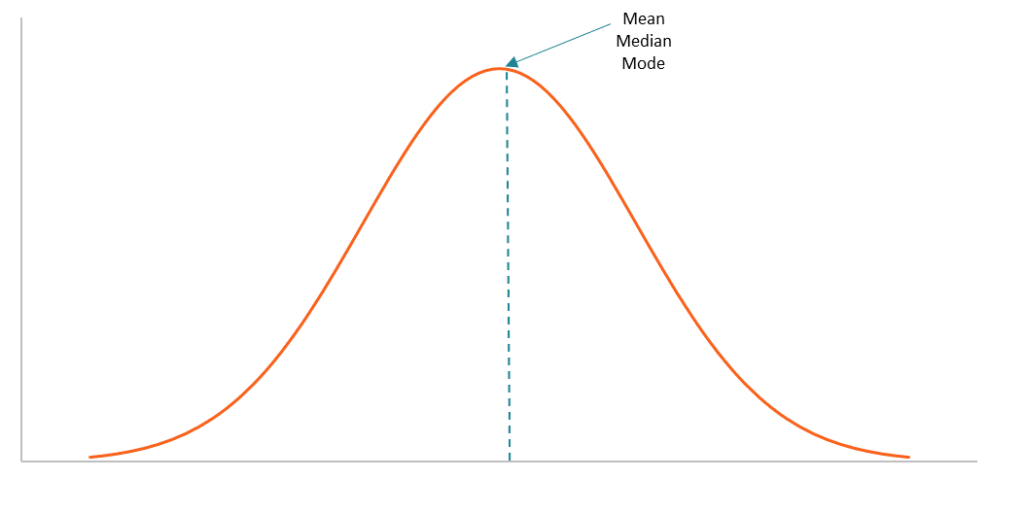
We use Central Tendency when we need to denote any collection of data into a unique single numeric value.
Measures of Central Tendency Example
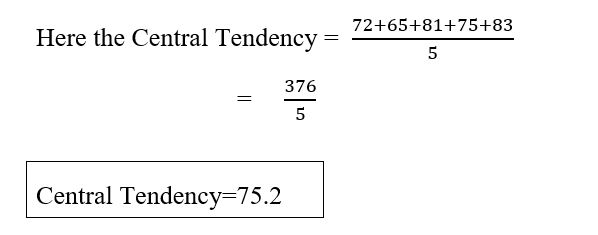
Mr. A has scored the following marks:
| Sr.No | Subject | Marks |
| 1 | English | 72 |
| 2 | Mathematics | 65 |
| 3 | Statistics | 81 |
| 4 | Hadoop | 75 |
| 5 | Python | 83 |
| Total | 376 |
How to calculate Central Tendency?
It can be calculated over three types of series:
Individual Series: Series of Data consisting only of single values.
Example: 2,3,4,512,45,56,79
Discrete Series: Series of data having a value and a frequency of the given value.
Example:
| X | 5 | 10 | 15 | 20 | 25 |
| F | 6 | 8 | 12 | 6 | 3 |
Continuous Series: Series of data having a frequency in a continuous manner.
Example
| Marks | 0-10 | 10-20 | 20-30 | 30-40 | 40-50 | 50-60 |
| Students | 2 | 15 | 13 | 18 | 12 | 4 |
Types of Measures of Central Tendency
There are three types of Measures of Central Tendency.
Mean
Median
Mode
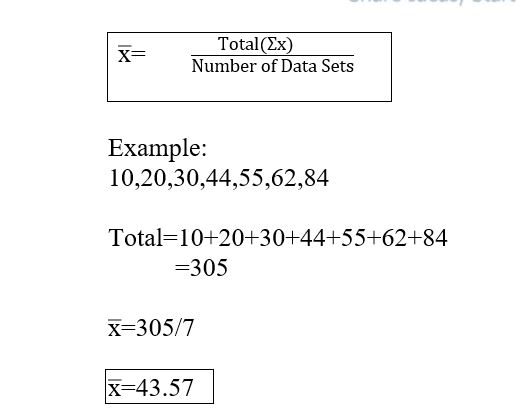
Mean
It is the most common method of finding Central Tendency. It is found by calculating the average value of the given dataset.
Individual Series
Discrete Series
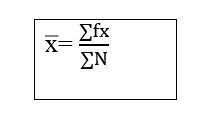
Where –
N = Frequency.
f= frequency
x=Item
Mean Example
| Items | 10 | 20 | 30 | 40 | 50 |
| Frequency | 2 | 5 | 6 | 9 | 4 |
| Xi |
|
fixi | ||
| 10 | 2 | 20 | ||
| 20 | 5 | 100 | ||
| 30 | 6 | 180 | ||
| 40 | 9 | 360 | ||
| 50 | 4 | 200 | ||
| Total | 26 | 860 |
x̅=860/26
x̅=33.07
Continuous Series
Continuous series Mean Example
| Items | 10 – 20 | 20 – 30 | 30 – 40 | 40 – 50 | 50 – 60 |
| Frequency | 2 | 5 | 6 | 9 | 4 |
Where –
N = Frequency.
f= frequency
x=item
| Items | Frequency | Xi | fiXi |
| 10 – 20 | 2 | 15 | 30 |
| 20 – 30 | 5 | 25 | 125 |
| 30 – 40 | 6 | 35 | 210 |
| 40 – 50 | 9 | 45 | 405 |
| 50 – 60 | 4 | 55 | 220 |
| Total | 26 | 990 |
x̅= 990 / 26
x̅=38.07.
Median
The median is the value of the variable which divides the group into two equal parts, one part comprising all values greater and the other all values less than the median.
Individual series
series in which only values are given
Arrange data into ascending order
M=(N+1)/2
Where: N= No of Items
Individual series median example
| 50 | 40 | 60 | 80 | 12 | 5 | 44 | 41 | 29 |
Now arrange data into ascending order:
| 5 | 12 | 29 | 40 | 41 | 44 | 50 | 60 | 80 |
N = Total number of terms = 9
Now = (N+1)/2
= (9+1) / 2
= 10 / 2 = 5
Median = 5th term = 41.
When N is Even value:
| 50 | 40 | 60 | 80 | 12 | 5 | 44 | 41 | 29 | 89 |
| 5 | 12 | 29 | 40 | 41 | 44 | 50 | 60 | 80 | 89 |
N = Total number of terms = 9
Now = (N+1)/2
= (10+1) / 2
= 11 / 2 = 5.
Median = 42.5
Discrete Series
Arrange data into ascending order
Calculate Cumulative frequency
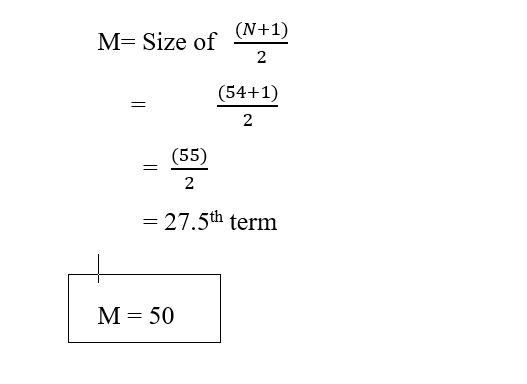
M=(N+1)/2
Where: N=total of frequency
Discrete Series median example
| X | 10 | 20 | 30 | 40 | 50 | 60 | 70 |
| F | 4 | 6 | 9 | 7 | 1 | 12 | 15 |
| X | F | Cf | Terms |
| 10 | 4 | =4 | 1-4 |
| 20 | 6 | 4+6=10 | 5-10 |
| 30 | 9 | 10+9=19 | 11-19 |
| 40 | 7 | 19+7=26 | 20-26 |
| 50 | 1 | 26+1=27 | 27-27 |
| 60 | 12 | 27+12=39 | 28-39 |
| 70 | 15 | 39+15=54 | 40-54 |
| Total | N=54 | N=54 |
Continuous Series
In this case, cumulative frequencies are taken and then the value from the class-interval in which (N/2)th term lies is taken. Using the formula.
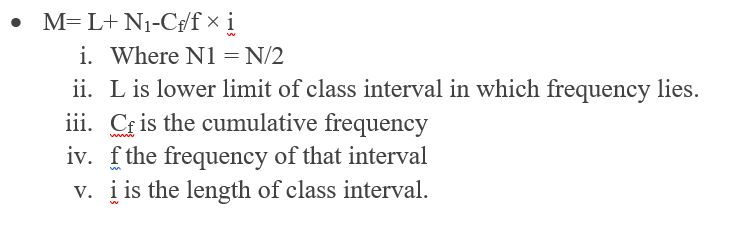
Median can also be calculated from the formula given below:
M= L – Cf-N1/f × i:
Where L is the upper limit of the median class.
Important Working Hints
Take N1=N/2
Looking from the lowest to the upper side in the Cf column we get the value which is firstly numerically less than N1. It is the value of Cf.
We come one step down; make the terms in column ‘f and also the class interval to get f and L. L is taken from a lower limit of the class interval.
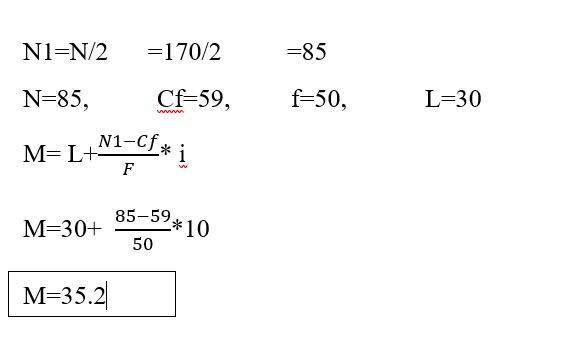
| Class Interval | 0-10 | 10-20 | 20-30 | 30-40 | 40-50 | 50-60 | 60-70 |
| Frequency | 7 | 18 | 34 | 50 | 35 | 20 | 6 |
Solution:
| Class Interval | Frequency (f) | Cumulative frequency (Cf) |
| 0-10 | 7 | 7 |
| 10-20 | 18 | 25 |
| 20-30 | 34 | 59 |
| 30-40 | 50 | 109 |
| 40-50 | 35 | 144 |
| 50-60 | 20 | 164 |
| 60-70 | 6 | 170 |
| N=170 |
Mode
It is the measure of central tendency targets towards pointing out the value that occurs most frequently in a series. This value, when it represents the data is known as the mode of the series. Mode simply refers to the value that occurs the maximum number of times in a distribution.
Calculation of Mode
Individual Series
In the case of individual series, we just have to inspect the item that occurs most frequently in the distribution. Further, this item is the mode of the series.
Individual Series mode example
| 2 | 1 | 3 | 6 | 6 | 5 | 1 | 2 | 2 | 3 |
| X | Repetition |
| 1 | 2 |
| 2 | 3 |
| 3 | 2 |
| 5 | 1 |
| 6 | 2 |
Here No 2 is repeated 3 times which is the highest.
Hence Mode = 2
Mode for Discrete Series
In discrete series, we have values of items with their corresponding frequencies. In essence, here the value of the item with the highest frequency will be the mode for the distribution.
Mode for Frequency Distribution
Lastly, for frequency distribution, the method for mode calculation is somewhat different. Here we have to find a modal class. The modal class is the one with the highest frequency value. The class just before the modal class is called the pre-modal class. Whereas, the class just after the modal class is known as the post-modal class. Lastly, the following formula is applied for calculation of mode:
Mode = l + h [(f1-f0)/(2f1-f0-f2)]
l= The lower limit of the modal class
f1 , f2 , f0 = Frequency corresponding to the modal class, post-modal class, and pre-modal class
Mode Example
| Class Interval | 10-20 | 20-30 | 30-40 | 40-50 | 50-60 |
| Frequency | 3 | 10 | 15 | 10 | 2 |
Answer: As the frequency for class 30-40 is maximum, this class is the modal class. Classes 20-30 and 40-50 are pre-modal and post-modal classes respectively. The mode is:
Mode= 30 + 10×[(15-10)/(2×15-10-10)]= 30+ 5= 35
These are the basic measures of central tendency in data science that a data analyst should know. Here, we have covered the basics of measures of central tendency in data science, its definition, types of measures of central tendency with example and how to calculate mean, median and mode.
We hope you liked our article on Measures of central tendency tutorial. Interested in learning more? Then get advanced data science certification course in Bangalore from Prwatech, the world’s best data science training institute.


