Regression Analysis
Regression Analysis Tutorial
Regression Analysis Tutorial, hunting for the best platform which provides information about regression analysis? Then welcome to the land of regression analysis in Data Science. In this regression tutorial, one can explore regression analysis meaning with examples, why we need it and different types of regression which were prepared by India’s leading Data Science training institute professionals.
Thinking of having a career as a Data analyst? Planning to go for a certification in Data science and related subjects but still not getting a conviction whether it is the right thing to do or not? Confused about whether to invest time in gaining knowledge of Data science or not? Such questions can give you sleepless nights, but by taking an advanced data science course from India’s largest E-Learning data science training institute in Bangalore, I am sure you will get a lot of reasons to build a data science career.
Regression Analysis Definition
Regression analysis is a field of great significance in statistics and machine learning. There are many regression methods available. Linear regression is one of them.
Regression explores relationships among different variables.
In General, in regression analysis, you usually consider some circumstances of interest and have a number of observations. Each observation has two or more features. Following the assumption that at least one of the features depends on the others, you will try to establish a relationship among them.
In short, you need to determine a function that maps some features or variables to others sufficiently well.
Examples of Regression analysis
You can observe several employees of a particular organization and try to understand how their salaries depend on various features, such as experience, level of education, role, the city they work in, and so on.
It is a regression problem where data related to each employee represents a single observation. The presumption is that the experience, education, role, and city are independent features, while the salary depends on them.
The dependent features are known as dependent variables and the independent features are known as independent variables, inputs, or predictors.
Regression problems normally have one continuous and unbounded dependent variable. However, the inputs can be continuous, discrete, or even categorical data such as gender, nationality, brand, and so on.
It is a common practice to indicate the outputs with ? and inputs with ?. If there are two or more independent variables, then they can be represented as the vector ? = (?₁, …, ?ᵣ), where ? is the number of inputs.
When Do You Need Regression?
Typically, you require regression to answer whether and how some phenomenon influences the other or how several variables are related. For example, one may use it to identify if and to what extent the experience or gender impact salaries.
Regression is also helpful when you need to forecast a response using a new set of predictors. For example, you could try to predict water consumption of a household for the next week given the outdoor temperature, time of day, and the number of members in that household.
Regression is utilized in many different fields: economy, computer science, social sciences, and so on. Its importance increases every day with the availability of great amounts of data and increased awareness of the practical value of data.
Types of Regression Analysis
Linear Regression
Linear regression is probably one of the most important and widely used regression techniques. It’s amongst the simplest regression methods. One of its main advantages is the ease of interpreting results.
Simple Linear Regression
Simple linear regression is the simplest type of linear regression with a single independent variable, ? = ?.
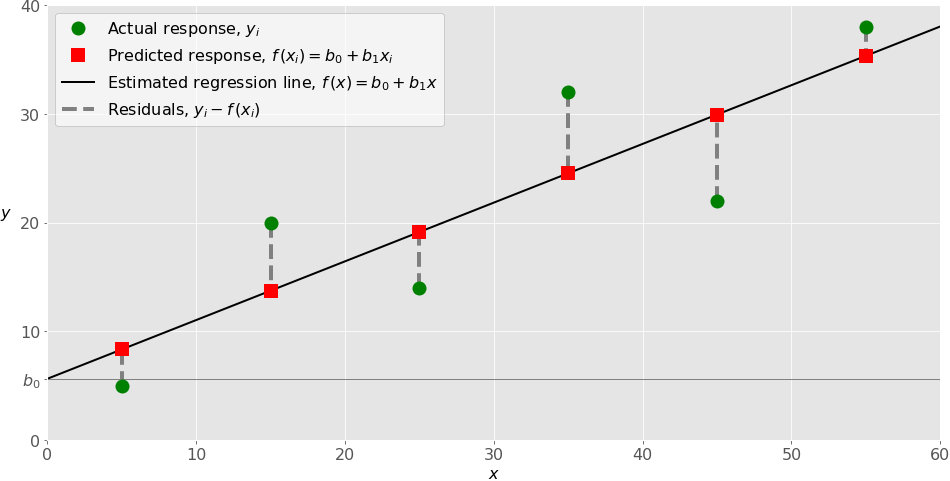
While implementing simple linear regression, you normally start with a given set of input-output (?-?) pairs (green circles). These pairs are your observations.
The estimated regression function (black line) has an equation
?(?) = ?₀ + ?₁?.
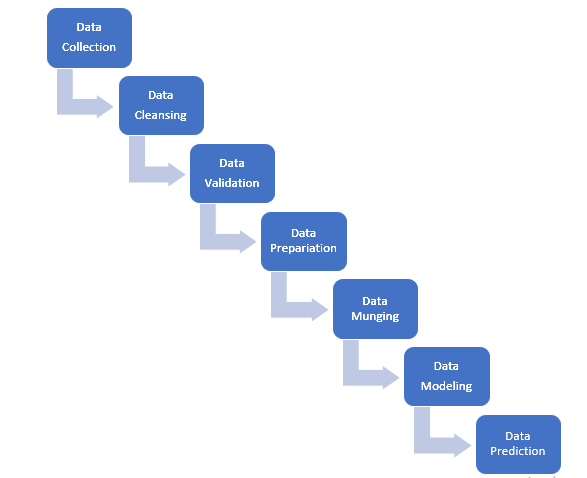
Steps Involved while implementing different models in Machine Learning:
Feature Selection Methods:
The different techniques of Feature Selections are as follows:
- Forward Selection
- Backward Elimination
- Recursive Feature Elimination
- Uni variate Selection
- Feature Importance
- Correlation Matrix with a Heat map
Forward Selection: Forward selection is an iterative method in which one starts with having no feature in a model. In every iteration, we keep adding the feature that best improves the model until the addition of a new variable doesn’t improve the performance of the model.
Backward Elimination: In backward elimination, we start with considering all the features and keep on removing the least significant feature at each iteration which improves the performance of the model. We will repeat this until there no improvement is observed on the removal of features.
Recursive Feature elimination: It is actually a greedy optimization algorithm that targets to identify the best performing feature subset. It repeatedly creates models and keeps aside the best or worst performing feature in every iteration. It will construct the next model with the left features until all the features are exhausted. It will then ranks features based on the order of their elimination.
Uni variate Selection: Statistical tests could be used to select those features that have the strongest relationship with the output variable. The scikit-learn library provides the SelectKBest class that can be used with a set of different statistical tests to select a particular number of features.
Feature Importance: You can get feature importance for each feature of your data set by using the feature importance property of the model. Feature importance gives you a score for every feature of your data, higher the score more relevant is the feature towards your output variable.
Correlation Matrix with Heat map: Correlation displays how the features are related to each other or to the target variable. Correlation may be positive (increase in one value of feature increases the value of the target variable) or the negative (increase in one value of feature decreases the value of the target variable).
# Last but not least, always ask for help!
We hope you have understood the basics of the regression analysis tutorial with examples in data science. Interested in learning more? Then get enroll with Prwatech for advanced Data science training institute with 100% placement assistance.


