Chi Square Test
Chi Square Test: Definition, Formula and Worked Examples
A survey of 20,000 people records each person’s gender and the party they support. At a glance, women seem to lean one way more than men. But is that a real pattern, or could it be chance in the sample? The chi square test is the standard tool for answering this kind of question when your data is made of categories.
It is one of the most used tests in data science. Analysts use it to check whether a marketing channel is linked to conversion, whether a defect type depends on the machine, or whether a die is fair. Because it works on simple counts, it does not need the data to be bell shaped, which makes it an easy first test to learn.
This tutorial explains what the chi square test is, its two main types, the formulas in plain text, a complete worked example from start to finish with the degrees of freedom, the critical value and the conclusion, the conditions that must hold, and how to run it in Python. If you are new to hypothesis testing, read about null and alternative hypotheses first.
What is a Chi Square Test?
A chi square test, written with the Greek letter chi squared, compares the counts you observed in categories with the counts you would expect if some idea were true. The bigger the gap between observed and expected, the stronger the evidence against that idea. It is used in hypothesis testing.
In a hypothesis test, you start with a null hypothesis, which is the default idea, such as the two things are not related. The test tells you how surprising your data would be if the null hypothesis were true. If it is very surprising, you reject the null hypothesis.
Why do We Need a Chi Square Test?
Our eyes are easily fooled by counts. A difference between 4,000 and 3,600 may look big or small, depending on the situation. The test turns the gap into a single number and a probability, so that the decision does not depend on opinion. It answers whether the gap is more than chance could easily produce.
Two Main Types
| Point | Test of independence | Goodness of fit test |
|---|---|---|
| Question | Are two categorical variables related? | Do the counts match an expected pattern? |
| Data | A table of counts, with rows and columns | One row of counts across categories |
| Example | Gender and political party | 500 heads and 500 tails expected in 1,000 coin tosses |
| Degrees of freedom | (rows minus 1) times (columns minus 1) | Number of categories minus 1 |
Conditions for Using the Test
- Counts, not raw records. The data must be counts of cases in categories. Do not use percentages or measurements such as heights.
- Independent observations. Each person or item appears once, and one case does not affect another. The live page says independent variables, which is not the right idea.
- Mutually exclusive categories. Every case falls into exactly one category.
- Large enough expected counts. The usual rule is that the expected count in each cell should be at least 5. The live page gives 30 to 40 as too small and 400 to 500 as valid, with no source. The cell rule is the standard one.
- Random sampling. The sample should be random, or at least not biased towards a result.
Chi Square Test Formula
Here O is the observed count in a cell and E is the expected count. Each cell adds one piece, and the pieces are summed. If observed and expected match exactly, the statistic is 0.
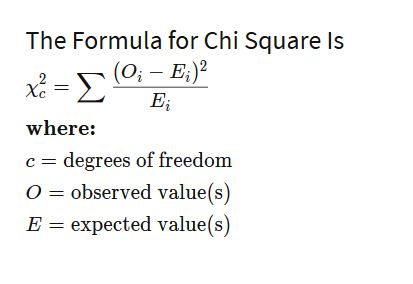
Degrees of freedom for a test of independence = (number of rows minus 1) times (number of columns minus 1). It decides which chi square curve you compare your statistic with.
Chi Square Test Example: Gender and Party
A survey asks 20,000 people for their gender and party. This is the data from the live page. The counts are made up for teaching.
| Gender | Republican | Democrat | Independent | Total |
|---|---|---|---|---|
| Male | 4,000 | 3,000 | 1,000 | 8,000 |
| Female | 5,000 | 6,000 | 1,000 | 12,000 |
| Total | 9,000 | 9,000 | 2,000 | 20,000 |
The hypotheses. The null hypothesis is that gender and party are independent. The alternative is that they are related. We use a significance level of 0.05.
Step 1: Expected Frequencies
If gender and party were independent, the expected count in each cell is the row total times the column total, divided by the grand total. For male Republicans, that is 8,000 times 9,000 divided by 20,000 = 3,600.

| Expected | Republican | Democrat | Independent |
|---|---|---|---|
| Male | 3,600 | 3,600 | 800 |
| Female | 5,400 | 5,400 | 1,200 |
Step 2: The Chi Square Statistic
For each cell, calculate (O minus E) squared divided by E, and add them up.

| Cell | Observed | Expected | (O minus E) squared divided by E | Value |
|---|---|---|---|---|
| Male, Republican | 4,000 | 3,600 | 400 squared divided by 3,600 | 44.44 |
| Male, Democrat | 3,000 | 3,600 | 600 squared divided by 3,600 | 100.00 |
| Male, Independent | 1,000 | 800 | 200 squared divided by 800 | 50.00 |
| Female, Republican | 5,000 | 5,400 | 400 squared divided by 5,400 | 29.63 |
| Female, Democrat | 6,000 | 5,400 | 600 squared divided by 5,400 | 66.67 |
| Female, Independent | 1,000 | 1,200 | 200 squared divided by 1,200 | 33.33 |
| Total | 324.07 |
The chi square statistic is 324.07. The live page shows 324.66, and gives 66.66 for the female Democrat cell, which should be 66.67. Adding the rounded values gives 324.06, and the exact total is 324.07.
Step 3: Degrees of Freedom and the Decision
The table has 2 rows and 3 columns, so the degrees of freedom are (2 minus 1) times (3 minus 1) = 2. At the 0.05 significance level, the critical value from the chi square table for 2 degrees of freedom is 5.991. Our statistic, 324.07, is far larger than 5.991. The p value is about 4.2 times 10 to the power minus 71, which is far below 0.05.
Conclusion: we reject the null hypothesis. In this data, gender and party are not independent. The live page stops before reaching this.
Step 4: Check the Size of the Effect
A very large sample can make a tiny difference look significant. To see how strong the link is, use Cramers V, which runs from 0 to 1. It equals the square root of (chi square divided by (n times (the smaller of rows and columns, minus 1))).
Here V = the square root of (324.07 divided by (20,000 times 1)) = 0.127. That is a small effect. So the right reading is that the relationship is real, but it is weak. A significant result is not the same as an important one.
Goodness of Fit Example: Is the Coin Fair?
You toss a coin 1,000 times. A fair coin should give 500 heads and 500 tails. The null hypothesis is that the coin is fair. The live page uses exactly 500 and 500, which would give a chi square of 0. Here are two more realistic results, which I calculated.
| Result | Chi square | df | p value | Decision at 0.05 |
|---|---|---|---|---|
| 530 heads, 470 tails | 3.60 | 1 | 0.058 | Not significant. The critical value is 3.841 |
| 560 heads, 440 tails | 14.40 | 1 | 0.00015 | Significant. Reject fairness |
For 530 heads: each category is off by 30, so the statistic is 30 squared divided by 500, twice, which is 1.8 plus 1.8 = 3.6. This is below 3.841, so a 530 to 470 split could easily happen by chance. Note that not significant does not prove that the coin is fair. It only means that we lack enough evidence to say that it is not.
Run It in Python
I ran the code below, and the output is real.
For a two by two table, chi2_contingency applies a continuity correction by default, called Yates correction. Keep this in mind if you compare its output with a hand calculation.
Common Mistakes to Avoid
| Mistake | Fix |
|---|---|
| Using percentages instead of counts | Use the actual counts |
| Using the test with expected counts below 5 | Combine categories, or use an exact test |
| Stopping at the chi square value | Add degrees of freedom, the critical value or p value, and a conclusion |
| Using the wrong degrees of freedom | (rows minus 1) times (columns minus 1) |
| Treating a significant result as a strong one | Report an effect size such as Cramers V |
| Using the test on the same people measured twice | Observations must be independent |
| Saying not significant proves no relationship | It means there is not enough evidence |
Practice Questions
- A table has 3 rows and 4 columns. How many degrees of freedom does a test of independence have?
- A cell has a row total of 200, a column total of 150 and a grand total of 1,000. Find its expected count.
- A die is rolled 600 times. A fair die should show each face 100 times. What are the degrees of freedom of the goodness of fit test?
- A chi square statistic is 3.2 with 1 degree of freedom, and the critical value at 0.05 is 3.841. What is the decision?
Answers: 1) (3 minus 1) times (4 minus 1) = 6. 2) 200 times 150 divided by 1,000 = 30. 3) 6 faces minus 1 = 5. 4) 3.2 is below 3.841, so do not reject the null hypothesis. These are my own answers, so please recheck them before publishing.
The chi square test is a three part habit: compare observed and expected counts, judge the result against the degrees of freedom, and then check how big the effect is. Work through the gender and party table by hand once, confirm it in Python, and you will be able to read any chi square result you meet.
