Hypothesis testing
Hypothesis Testing: Definition, Steps and Worked Examples
A shampoo company tries a new formula on 200 buyers. Out of them, 78 buy it again. In the past, only 30 percent of buyers came back. Is 39 percent a real improvement, or just luck in one small sample? Hypothesis testing gives you a clear, fair way to answer.
It is the backbone of data science. Every A and B test, every claim that a model is better, and every study that says a drug works is a hypothesis test. The method is simple: assume nothing has changed, then ask how surprising your data would be if that were true.
This tutorial explains the definition, the null and alternative hypothesis, the steps, the p value and significance level, two types of error, and two worked examples with all the numbers. It also shows how to run the test in Python. No advanced maths is needed.
Meaning and Definition of Hypothesis Testing
A statistical hypothesis is a claim about a population, for example that the average is 50, or that 30 percent of buyers return. Hypothesis testing is a formal method that uses sample data to decide whether there is enough evidence to reject that claim.
You rarely have data for the whole population. So you take a random sample and check whether it fits the claim. If the sample would be very unlikely under the claim, you reject the claim. The live page says this too, but it does not use the word likely, which is the key idea.
Types of Hypothesis: Null and Alternative
| Point | Null hypothesis (H0) | Alternative hypothesis (H1 or Ha) |
|---|---|---|
| Meaning | No effect, no difference, or the status quo | There is an effect or a difference |
| Example | The repeat purchase rate is still 30 percent | The repeat purchase rate is above 30 percent |
| Role | The default that we try to reject | What we accept if the data are strong enough |
The two hypotheses must be mutually exclusive, which means both cannot be true at the same time. Note that the live page says the null hypothesis usually states that the event will not occur. The more accurate idea is no effect or no difference.
Why do We Need Hypothesis Testing?
Samples vary. A new shampoo may do better in one sample just by chance. Without a test, you either trust every small gain, or ignore real ones. A hypothesis test tells you how likely a result like yours is under pure chance, and it lets you decide before you see the data how much evidence is enough.
The live page gives a shampoo launch example with the null hypothesis that the product will fail. That cannot be tested as written, because fail and succeed are not measured quantities. A testable version is the repeat purchase rate, which I use below.
Steps of Hypothesis Testing
- State the hypotheses. H0 and H1, so that only one can be true.
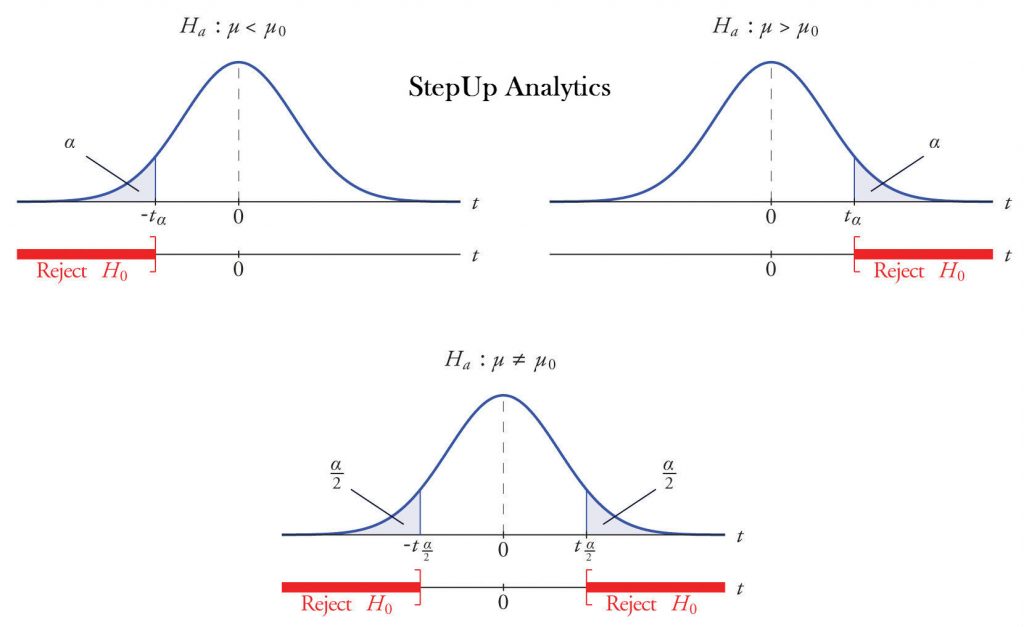
- Choose the significance level, alpha, usually 0.05. Decide this before looking at the data.
- Choose the test and check its conditions. Z test, T test, chi square and so on.
- Calculate the test statistic and the p value from the sample.
- Decide. If p is less than alpha, reject H0. If not, fail to reject H0.
- Write the conclusion in plain words, in terms of the original question.
The live page’s second step says to make an analysis plan, and the third says to physically analyze the data. The word should be statistically, and the plan should include alpha and the test.
Hypothesis Testing P Value
The p value is the probability of getting a result at least as extreme as the one you saw, if the null hypothesis is true. It is a probability between 0 and 1, not an area or a region.
- A small p value means your data would be surprising if H0 were true. This is evidence against H0.
- A large p value means your data are quite normal under H0. There is not enough evidence against it.
P Value vs Significance Level
| Term | Meaning |
|---|---|
| Significance level (alpha) | The cut off you choose before the test, usually 0.05. It is the false positive risk you accept |
| p value | Calculated from your data. Compare it with alpha |
The live page says one normally uses the p value is 0.05. That is the significance level, not a p value.
| Result | Decision |
|---|---|
| p less than 0.05 | Reject H0. The evidence is strong enough |
| p more than 0.05 | Fail to reject H0. There is not enough evidence |
Two cautions. First, a p value is not the probability that H0 is true. Second, a small p value does not prove the alternative. It says the data are hard to explain by chance alone.
Hypothesis Testing P Value Method: Worked Examples
Example 1: The Shampoo Test (Z Test for a Proportion)
Past repeat purchase rate: 30 percent. New trial: 200 buyers, 78 buy again. The numbers are made up for teaching.
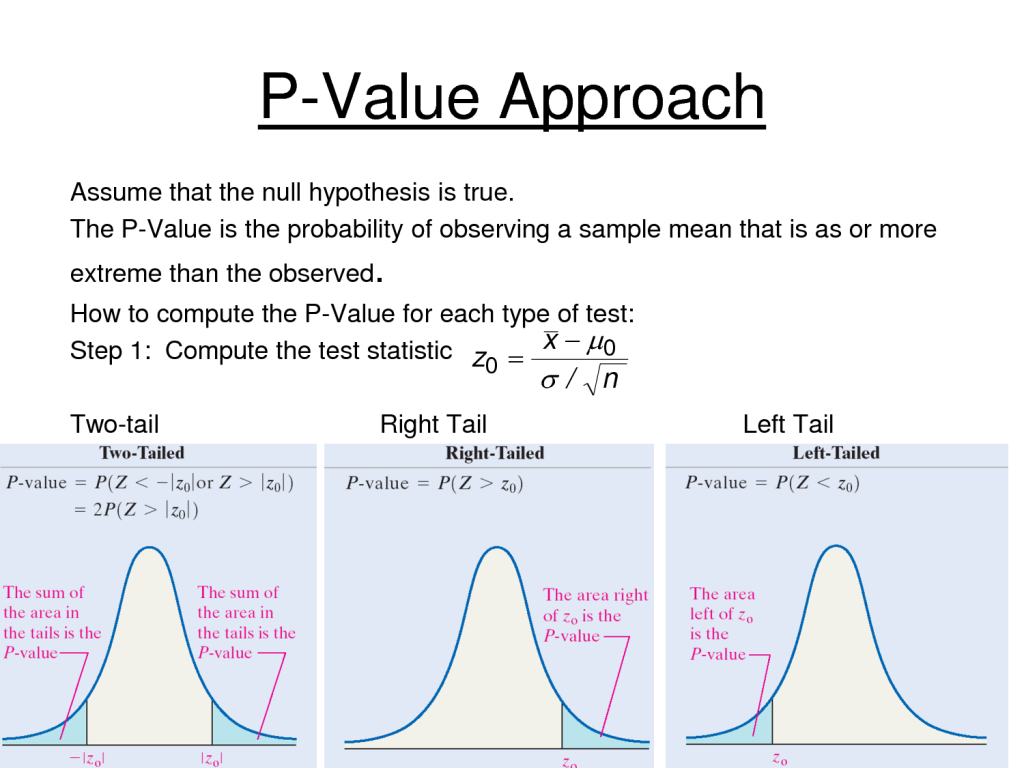
- Hypotheses. H0: the rate is 0.30. H1: the rate is more than 0.30. This is a one tailed test.
- Alpha = 0.05.
- Sample rate = 78 divided by 200 = 0.39.
- Standard error under H0 = square root of (0.30 times 0.70 divided by 200) = 0.0324.
- Z = (0.39 minus 0.30) divided by 0.0324 = 2.78.
- p value = area to the right of 2.78 = 0.0027.
Conclusion: p is below 0.05, so we reject H0. There is evidence that the repeat purchase rate of the new shampoo is above 30 percent. If the company cared about a change in either direction, a two tailed test would give p = 0.0055, which is also significant.
Example 2: The Investor Claim (Two Tailed Test)
The live page: an investor says that the portfolio performs almost the same as the index. The null hypothesis is that the returns are equal, and the alternative is that they are not. Since the difference can go either way, this is a two tailed test. The page says p = 0.001 but shows no data. Here is a made up version with real numbers.
We record the monthly return gap, portfolio minus index, in percentage points for 24 months. The mean gap is 0.733 points.
- Hypotheses. H0: the mean gap is 0. H1: the mean gap is not 0.
- Test. One sample T test on the 24 gaps, since the standard deviation is unknown.
- Result. t = 7.30, and the two tailed p value is 0.0000002.
Conclusion: p is far below 0.05, so we reject H0. The portfolio returns differ from the index. The mean gap is positive, so the portfolio did better in this sample. Be careful with the wording: the test shows that the gap is unlikely to be chance, not that the portfolio will keep winning.
The live page says the p value helps the investor determine risk. It does not measure risk. It measures how surprising the data are under H0.
Type 1 and Type 2 Errors
| Outcome | H0 is really true | H0 is really false |
|---|---|---|
| Reject H0 | Type 1 error, a false positive, with probability alpha | Correct decision |
| Fail to reject H0 | Correct decision | Type 2 error, a false negative |
Lowering alpha reduces false positives but makes false negatives more likely. A larger sample helps with both.
Run Hypothesis Tests in Python
I ran the code below, and the output is real.
Common Mistakes to Avoid
| Mistake | Fix |
|---|---|
| Calling 0.05 the p value | 0.05 is the significance level. The p value comes from the data |
| Saying the p value is the chance that H0 is true | It is the chance of data this extreme if H0 is true |
| Saying we proved the alternative | Say that there is enough evidence for it |
| Saying we accept H0 when p is high | Say that we fail to reject H0 |
| Changing alpha after seeing the result | Fix alpha before the test |
| Using a one tailed test to get a smaller p value | Choose the direction before the data |
| Confusing significant with important | Also look at the size of the effect |
| Running many tests and reporting only the significant one | Report all tests, or adjust for multiple tests |
Practice Questions
- A test gives p = 0.03 at alpha 0.05. What is the decision? What if alpha were 0.01?
- Write H0 and H1 for the claim that the average delivery time is 3 days. You want to detect a change in either direction.
- In the shampoo example, what is the sample rate and the Z value?
- What kind of error is it if you reject a true null hypothesis?
Answers: 1) Reject H0 at 0.05, but fail to reject at 0.01. 2) H0: the mean is 3 days. H1: the mean is not 3 days. 3) 0.39 and 2.78. 4) Type 1 error. These are my own answers, so please recheck them before publishing.
Hypothesis testing is a habit of mind: assume no change, measure how surprising your data are, and decide by a rule you set before looking. Keep alpha and p apart, never say proved, and always say what the numbers mean in plain words.
